| Other Pages: Senior Planning | Financial Planning | Budgeting | Saving | Investing | Retirement | Inflation (CPI) | Estate Planning | Senior Living Costs | Long Term Care Insurance | Real Estate | Interest Rates | 2008 Recession | charts | Best Places to Live | Senior Living |
Contents:
Under Construction 
This page is for people getting close to retirement. The bigest mistakes people make in retirement planning are:
How Much Do you need: What you need to do is: 1. Do a budget to figure out what your retirement expenses will be. Housing, Food, Transportation, Entertainment, Travel, Medical... See Cost of Living below. 2. Figure out what you will get from social security, a pension if you have one and other sources of income.
3. The difference is what you need to take out of your IRA.
At
"Stop Freaking Out About Retirement" - Consumer Reports, Oct. 2014 they say,
In Yes, You Can Still Retire Comfortably!, 2006 Ben Stein and Phil DeMuth say, Fidelity says you should have the following:
i.e. if you are 50 and make $80,000/yr you should have $480,000 in savings and keep saving at the same rate to retire at age 67 with $800,000 in savings. It assumes you will keep spending (housing, transportation, food, entertainment, ...) at the same rate after you retire and also will have Social Security income but no pension. It will take you through age 93. Of course if you are a teacher or other government worker with a good pension package, you will need less. It also assumes 45% income replacement (I guess they are saying Social Security (SS) will provide 55%. This is true for low income people, but with a median income of $46,000 over a 35 year working period SS would only provide 40%.) If you want to retire at age 65 you will need 12x your salary or $960,000. Their investment growth assumptions are based multiple market simulations based on historical market data and assuming an average equity (stocks, derivatives, ...) of more than 50%. They don't specify the period of time and growth rate they used in the simulations.
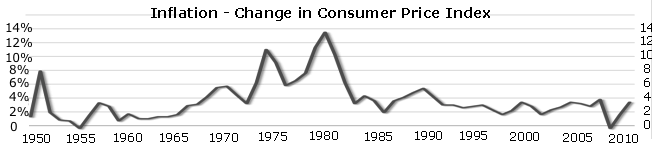
Stein-Demuth: Can you afford to retire? - MarketWatch quotes a report by Hewitt Associates which says you should have 11 times your salary which with 4.7 times your pay in Social Security will give you 15.7 times. See also saving for retirement in savings. How much you will need in the future depends on inflation. Inflation 3% (See charts for average inflation)
Where will it come from?: At The "MetLife Study of Gen X:" they say, 50% - pensions, 401(k)s and other retirement plans 30% Social Security 20% Other savings * Gen X are generally people born from 1961-1980.
Saving for Retirement Because of compounding the more you save early in your career, the better off you'll be. See savings.
Net Worth by Age Percentile Calculator (United States) - DQYDJ Federal Reserve Survey of Consumer Finances (SCF) Data Survey of Consumer Finances (SCF) FederalReserve.gov Note: Families with holdings in the chart above include those with stocks or property.
See Income data on the budget page Social Security: Benefit for Workers with Maximum-Taxable Earnings | ssa.gov As of 2015 Retire at 65 - $29,424 Retire at 70 - $42,012
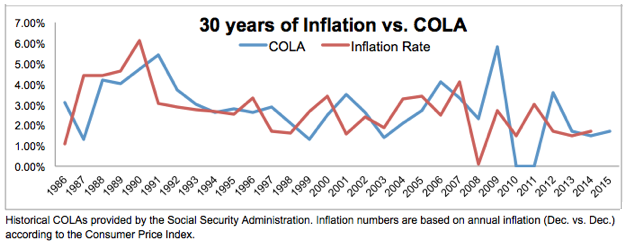
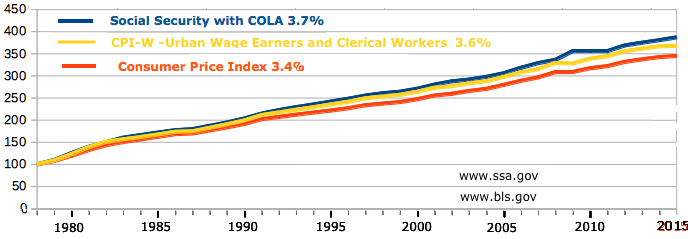
1. The Social Security (SS) Cost-of-Living Adjustment (COLA) is based on the Consumer Price Index for Urban Wage Earners and Clerical Workers (CPI-W). For the last 20 years it has been pretty close to the regular CPI.
See Proposed Changes to Social Security's Cost-of-Living
Adjustment: What Would They Mean for Beneficiaries? | AARP 2012 Making your IRA last depends on inflation and portfolio growth.
S&P Average Annual Growth
 This chart shows the average rate of return at the end of 25 years of investing a fixed amount each year. For example if you invested from 1988 to 2013 in a S&P Exchange Traded Fund (ETF) you would get the same amount as investing in something that would return 6% per year over that period. 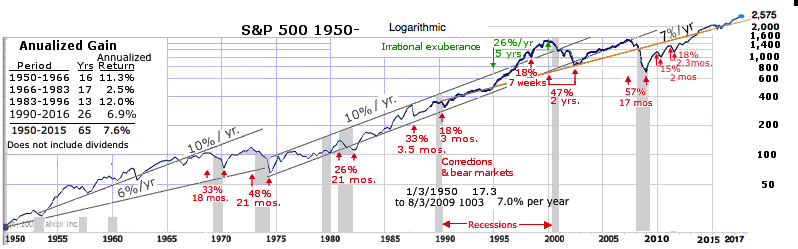
Probability of a given minimum return based on the number of years above which exceed it.
S&P dividend yield has averaged 2.4% for the last 30 years and 1.8% over the last 15. They have been steadily declining as companies reinvest more of their profits.
4% rule:
My basic thinking is if your portfolio is growing at 7% and inflation is 3% you can take out 4% and maintain your value. If it weren't for the Required Minimum Distribution (RMD) which kicks in at age 70½ and increases to 5.1% at at age 79 this would be true.
A sample calculation.
7% is slightly less than both the 60 year and 20 year growth of the S&P index. see charts. Sample calculations. Get the Excel spread sheet so you plug in your own numbers.
1. Required Minimum Distribution (RMD) The RMD is different for IRA owners whose spouse is the sole beneficiary of their IRA and is more than 10 years younger. Click here for an excel spread sheet you can download to plug in your own numbers
2. Expenses: This example is for someone living in a major metropolitan area with higher than average expenses. $35,000 - $45,000 is a more normal national average for 2 adults and $48,000-$65,000 for 2 adults and a child..
3. Other income - Income with a Cost of Living (COL) increase: e.g. Social Security, Other Investments.
4. Distribution = max of inflation adjusted expenses or RMD.
5. Excess - RMD is greater than the expenses needed to keep up with inflation. Of course the market does not grow consistently; There are bull and bear market periods. 6. The minimum need from the IRA is expenses minus other income. 7. Average life expectancy from actuarial tables. IRS uses a higher number for RMD. See Longevity
See: Stock (equity securities) and Bond (Fixed-income securities) mix: Conventional wisdom was that the percent of your portfolio held in bonds should be equal to your age. The reason is that as you get older you don't want to get stuck having to make withdrawals in a bear market (stock prices down).
Most investment advisors have gotten away from this increased fixed income strategy.
Fisher Investments did a simple Monte Carlo simulation* to produce results for several scenarios. Here is one taking annual withdrawals of $50,000 (5%) from a $1,000,000 portfolio over 30 years. It does not take into account RMD and inflation. It appears the primary purpose was to debunk the old adage of more fixed income as you age .
It makes numerous assumptions, including but not limited to, the use of S&P 500 Stock Index and/or US 10-year Government Bond Index historical returns See What Is the Best Stock-to-Bond Ratio? - For Dummies Other withdrawal stratagies: "New Math for Retirees and the 4% Withdrawal Rule" - NYTimes.com lists some other stratagies. Assumptions: A 65-year-old couple begins with a $1 million portfolio consisting of 50/50 stocks and bonds. The strategies below assume annual spending will never dip below $15,000 in inflation-adjusted terms over 30 years. | |||||||||||||||||||||||||||||||||||||||||||||||||||||||||||||||||||||||||||||||||||||||||||||||||||||||||||||||||||||||||||||||||||||||||||||||||||||||||||||||||||||||||||||||||||||||||||||||||||||||||||||||||||||||||||||||||||||||||||||||||||||||||||||||||||||||||||||||||||||||||||||||||||||||||||||||||||||||||||||||||||||||||||||||||||||||||||||||||||||||||||||||||||||||||||||||||||||||||||||||||||||||||||||||||||||||||||||||||||||||||||||||||||||||||||||||||||||||||||||||||||||||||||||||||||||||||||||||||||||||||||||||||||||||||||||||||||||||||||||||||||||||||||||||||||||||||||||||||||||||||||||||||||||||||||||||||||||||||||||||||||||||||||||||||||||||||||||||||||||||||||||||||||||||||||||||||||||||||||||||||||||||||||||||
| STRATEGY |
Constant inflation-adjusted spending Retirees begin by withdrawing a given percentage of their initial retirement portfolio. Each year thereafter, the withdrawal amount is increased to match the inflation rate. |
Bengen's floor-and-ceiling rule In the first year, retirees withdraw a given percentage of their portfolio. After that, withdrawals could increase by up to 25% in bull markets, or decrease by not more than 10 percent in bear markets. |
Guyton and Klinger's decision rules Withdrawals are increased each year to match inflation, except in years when the portfolio loses money. If the withdrawal rate ever rises to more than 120% of the initial rate, that year's withdrawal is cut by 10 percent. In good years, withdrawals may increase by 10 percent. | |||||||||||||||||||||||||||
| INITIAL SPENDING RATE |
2.85% Rate adjusts to keep withdrawals steady with inflation. |
3.29% Rate is allowed to fluctuate within certain upper and lower limits according to the strength of the market. |
4.95% Rate fluctuates to keep withdrawals steady with inflation and to reflect bull markets. | |||||||||||||||||||||||||||
| RANGE OF ANNUAL WITHDRAWALS* | $28,500 | $28,000 - $39,500 | $15,800 - $61,000 | |||||||||||||||||||||||||||
|
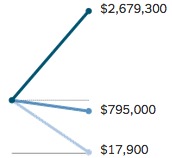
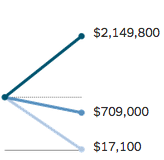
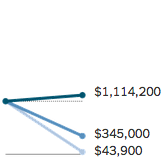
MONEY LEFT AFTER 30 YEARS 
|
|
|
| |||||||||||||||||||||||||||
|
* Range of withdrawals illustrates best, average and worst case situations Source: Wade Pfau, professor of retirement income at the American College of Financial Services. By The New York Times See Retirement Researcher, Wade Pfau, Ph.D., CFA Required Minimum Distributions (RMDs): Tax law requires individual retirement account holders to begin taking out at least minimum amounts, known as required minimum distributions, or RMDs, from their accounts once they reach age 70 1/2. Technically, that means the IRA money must start coming out in specific increments no later than April 1 following the year you reach that age. The exact distribution amount changes from year to year. It is calculated by dividing an account's year-end value by the distribution period determined by the Internal Revenue Service. It starts at 3.6% at age 71 and grows to 8.8% at age 90 and 15.9% at age 100. Converting some to Roth: Converting a traditional IRA to Roth is usually not considered to be cost effective for you, but can be beneficial for your dependents. Wells Fargo has the following guidelines. A Roth conversion makes sense if:
See
Estate planning opportunities with Roth IRA conversions | Vangard
Some people take out the maximum which will keep them from going to a higher tax bracket and convert it to a Roth each year.
See Estate Tax | IRS
State Estate and Inheritance Taxes in 2014 | Tax Foundation
Cost of Living: Living Wage Calculator - Introduction to the Living Wage Calculator | MIT March, 2014, says, "The living wage varies based on the cost of living and taxes where families live. Families of four (with two working adults, two children) in the North ($56,179) and West ($53,505) have higher median living wages before taxes than the South ($49,167), and Midwest ($48,496). Within region, the largest variation is between Southern states, where the living wage ranges from $45,655 in South Carolina to $69,820 in the District of Columbia." Home Rent vs Own: according to a report from Trulia. For retirees, buying is cheaper than renting in all major metros. However, if a retiree does not plan to pass the home on to heirs, it's nearly always cheaper to rent than to buy. You could also look at home ownership as an investment. Home prices have increased at a rate of 5.5% from 1991-2015. That's less than the stock market which did 7% during that time, but it may be safer than stocks and an alternative to CDs or Bonds which still had low returns as of 2016.
The other consideration is do you want to have your own garden and are you willing to invest the time and money into maintenance on a home you own. See Also: Budgeting and Cost of living by location in Household Spending. Senior and Assisted Living costs Software/Calculators: Stein and Demuth recommend: QUANTEXT Portfolio Planner ESPlanner Inc. The 3 Best Free Retirement Calculators - Can I Retire Yet? Vanguard - Retirement nest egg calculator Ultimate Retirement Calculator | FinancialMentor.com The Flexible Retirement Planner | A financial planning tool powered by Monte Carlo Simulation Books: "Yes, you can retire"..| Ben Stein and Phil Demuth | www.stein-demuth.com The Boomer's Guide to a Great Retirement: You Can Do It!: Jonathan D. Pond | Online Tools
Links:
| ||||||||||||||||||||||||||||||