Under Construction 
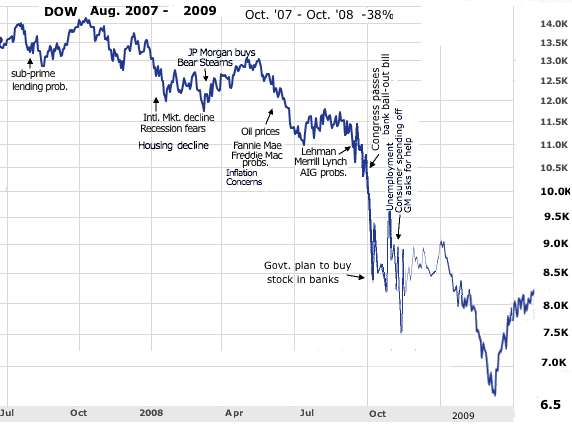
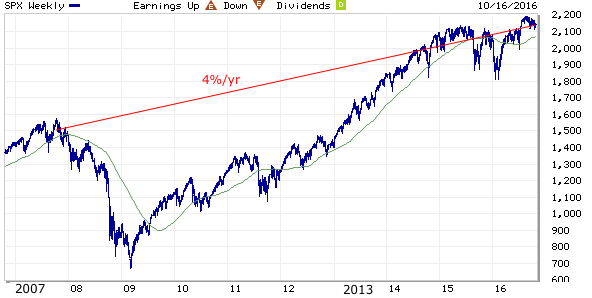
The Bear market started with the Sub-prime lending market problems in Sept. 2007,
the longest profit slump in six years, the first nationwide decrease in home prices since the Great Depression, record oil prices and fears of a recession resulted in a 26% market decline in 2008.
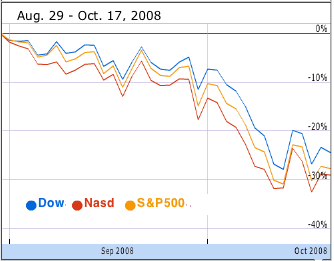
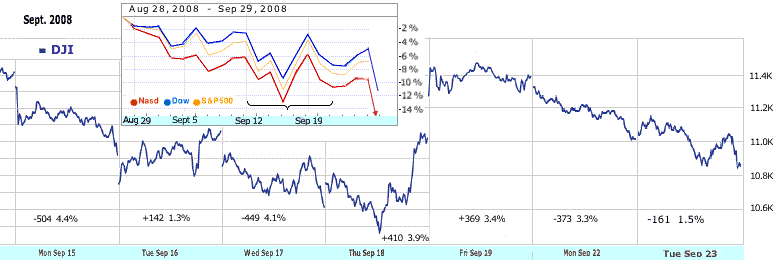
Over the weekend and on Monday, Sept. 15, 2008 Merrill Lynch, one of the biggest and best-known brokerage firms in the world, was sold to Bank of America for $50 billion due to financial difficulties stemming from problems in the mortgage markets. Lehman Brothers, unable to find a buyer, filed for bankruptcy . On Wed. the US Federal Reserve struck a deal to take control of AIG in return for an $85bn loan to stave off a collapse of the giant.
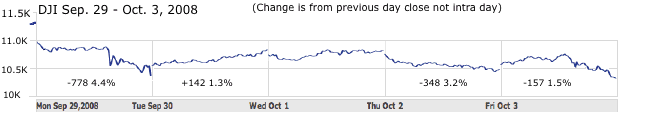
On Monday, Sept. 29 the congress rejected a "bail-out" bill to authorize $700 Billion for the government to buy up bad loans; the Dow dropped 777 points or 7%, the S&P dropped 8.8% and the Nasdaq dropped 9.1%.
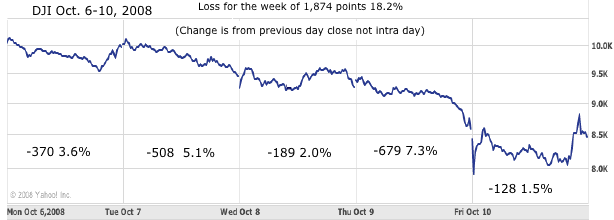
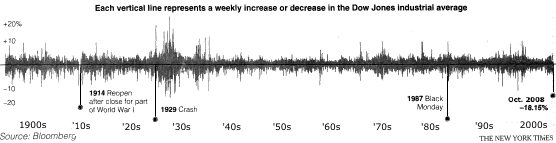
The week of Oct. 6-10 was the worst week in history point wise when the Dow dropped 1,874 points or 18.2% 2nd worst percent loss since the 1929 depression.
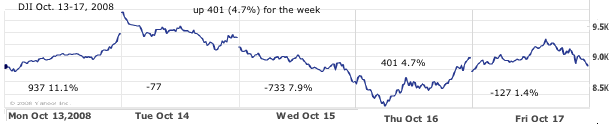
On Monday Oct. 13 the market had it's largest single day gain of 936 points on the Dow or 11.1%
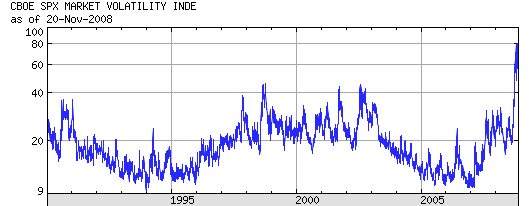
The Chicago Board of Options Exchange (CBOE) Volatility (Fear) Index (VIX) hit a record of 80.9 on Nov. 20, 2008
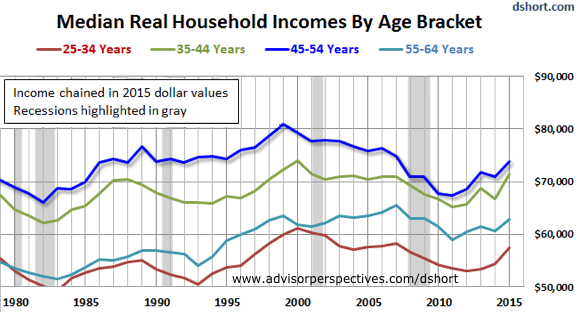
It took almost 5 1/2 years to recover. Effect on Income: 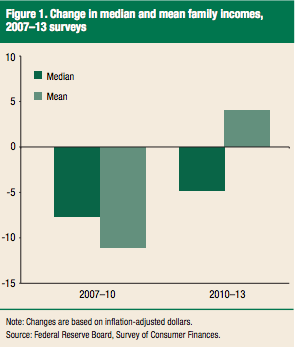
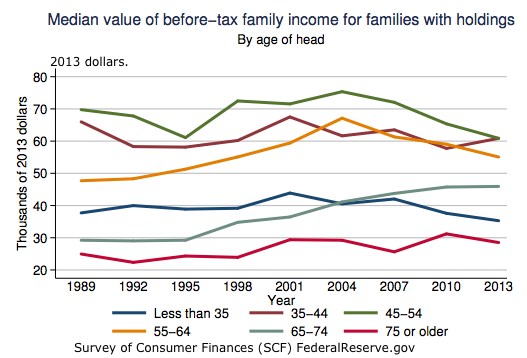 Source: Survey of Consumer Finances (SCF) FederalReserve.gov Mean income (average of all incomes) is about twice the median (income level with 50% above and 50% below) because of very high income families. See mean income. Households with holdings are those who own stocks, homes, etc. By 2013 almost 100% of families headed by someone about the age of 35 had some type of asset. For families where the householder was under the age of 35, the percent holding assets fell from 97 percent to 92 percent.
Net Worth took a even bigger hit
Percentage of families holding specific types of assets:
See Also: Market Volitility Bear Markets
Return to Investing
| ||||||||||||||||||||||||||||||||||||||||||||||||||||||