| Financial Planning | Budgeting | Saving | Investing | Retirement | Senior Living Costs | Real Estate | Interest Rates | Charts |
|
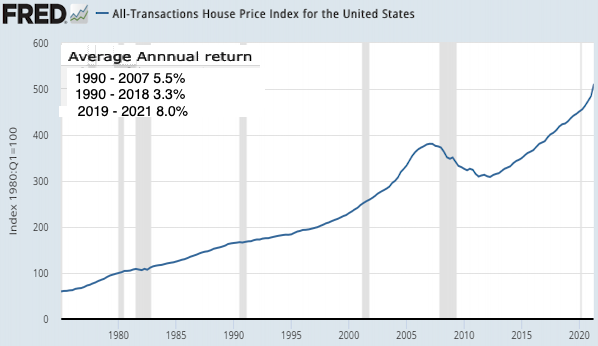
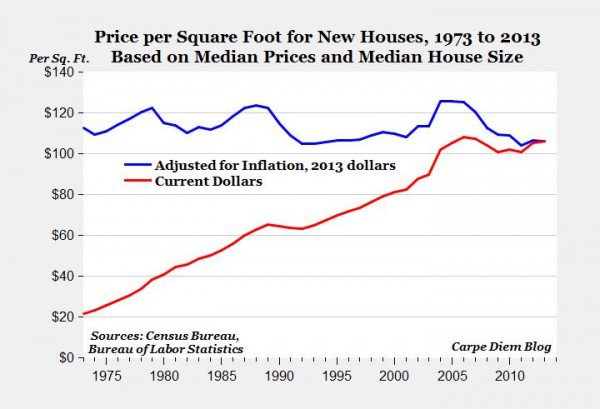
In 1950, the median home price was just $7,354. It peakat at $227,100 in 2006. What's the reason for the dramatic increase? More Home Means More Money One driver of home prices is size. In 1950, the average home size was less than 1,000 square feet with two bedrooms and one bath. By 1970, the average home was 1,500 square feet and included a third bedroom and another half-bath. When home prices peaked, the average home was two stories and 2,500 square feet with two and a half baths and a two-car garage.
Note: price per Sq. Ft. is over $200 in major metropolitan areas. Source: 60 Years of Home Prices: The Difference Will Shock You - daveramsey.com
Real Estate Investing: The FTSE NAREIT US Real Estate Index Series is designed to present investors with a comprehensive family of REIT performance indexes that spans the commercial real estate space across the U.S. economy. 
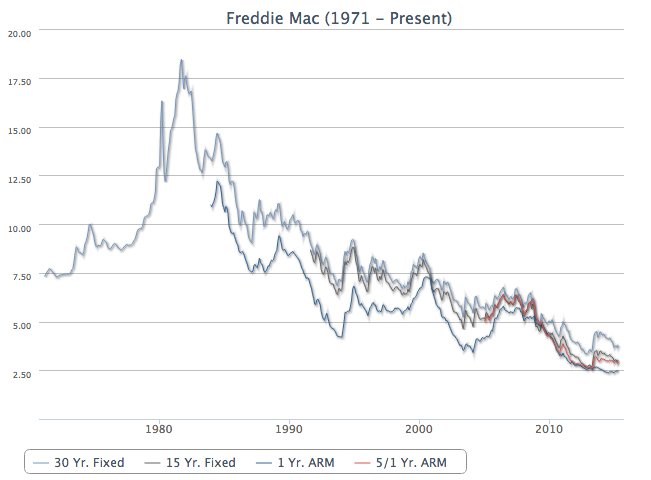
Income property vs Stocks: Links: Average 30 Year Fixed Mortgage Rates | MortgageNewsDaily.com Historical Census of Housing Tables Home Values - Housing Topics by state 1940 - 2000 - U.S. Census Bureau Median and Average Sales Prices of New Homes Sold in United States 1963 - 2010 | Census Bureau House Price Index for the United States - Federal Reserve Economic Data (FRED) Compare cost of living, crime, cities, schools and more. Sperling's BestPlaces House Price Index Datasets | Federal Housing Finance Agency (FHFA) House Price Index for the United States - FRED Understanding Recent Trends in House Prices and Home Ownership., 2007 Historical Census of Housing Tables Home Values - by State - U.S. Census Bureau
| |||||||||||||||||