| Financial Planning | Budgeting | Saving | Investing | Retirement | Senior Living Costs | Real Estate | Interest Rates | Charts | Inflation (CPI) |
Investing: See CPI - Inflation What this says is that if for example you invested a fixed amount each year in an S&P 500 ETF starting in 1985 you would end up with the same amount in 2010 as if you invested the same amount annually in a instrument that would give you a fixed 6% growth a year. S&P 1950- 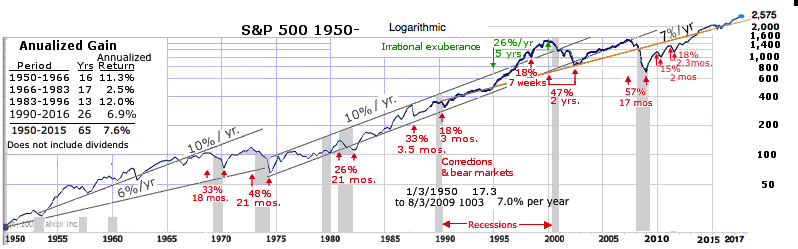
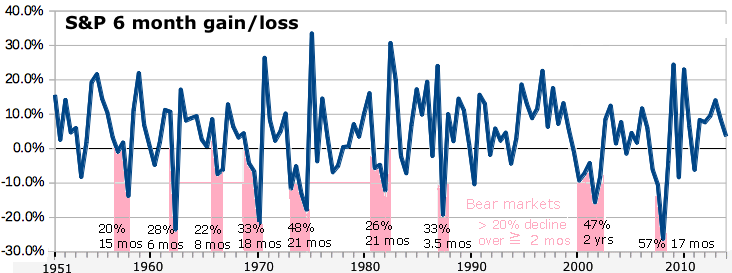
Average: 7.3%. The early low returns were due to market stagnation from 1966-1983 when the dow hit a psychological barrier at 1,000 and high interest rates and inflation in the late 70's and early 80's. Recent low returns were from the .com bust in 2000 and the recession in 2008.
Probability of a given minimum return based on the number of years above which exceed it.
* You can argue that we know how to control inflation now and we won't have another period like the 70's, but I've worked with economists before and just when they think they've found all the variables that affect a number, something they never thought of comes up.
Why do analysts tell you the average long term gain is 10-12%?
1950-2014
See also: Consumer Price Index change - Inflation  Gas and Oil prices
Salary Growth: 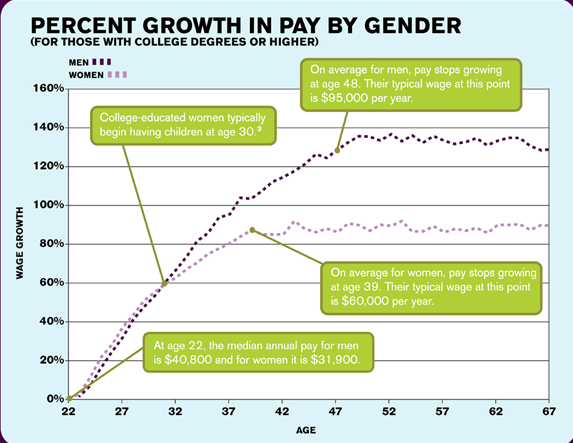 Source: Do Men Really Earn More Than Women? - PayScale.com (2012) House Prices 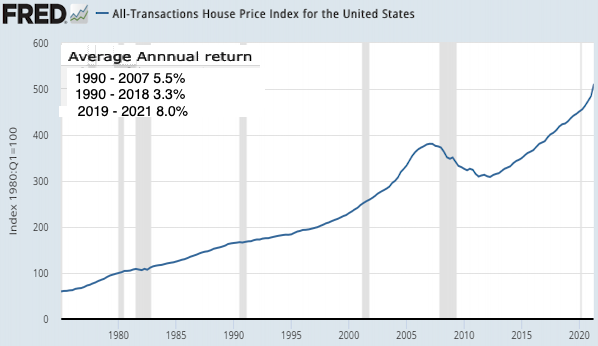
But houses also got larger.
Note: In metropolitan areas houses can cost more than $200 per sq ft. Census Bureau data showed: 2006 Median Average $246,500. $305,900Sources: House Price Index Datasets | Federal Housing Finance Agency (FHFA) House Price Index for the United States - Federal Reserve Economic Data (FRED) 60 Years of Home Prices: The Difference Will Shock You - daveramsey.com See housing Intrest Rates 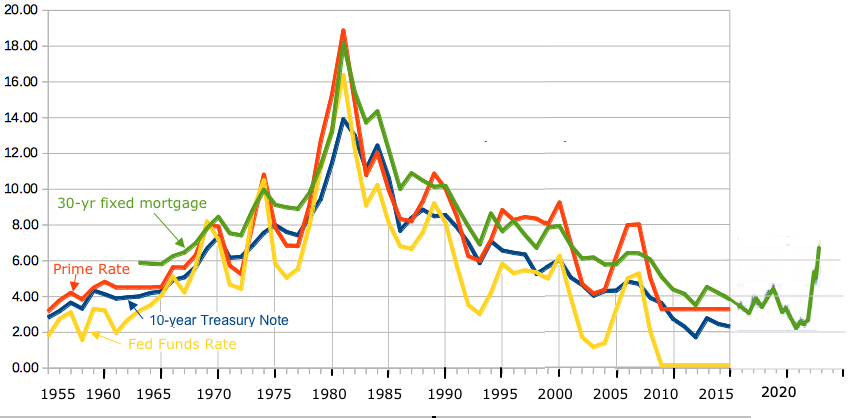 Mortgage rates are as of August, Others are May or June.
See Interest Rates Links: Financial Planning Investing Retirement more S&P charts United States Average Monthly Prime Lending Rate | 1950-2015 | Data | Chart Shadow Government Statistics - Home Page
| ||||||||||||||||||||||||||||||||||||||||||||||||||||||||||||||||||||||||||||||||||||||||||||||||||||||||||||
