|
Contents: Time line of projectons | Swing States | Maps | last week changes | Polls |
Voter discrimination in the south | Republican Primary
| 2016-election-hype
| 2016-election-postmortem
| 2016-election-swing-states
| 2016-exit-polls
| Glossary
See also: Results
| Campaign Hype
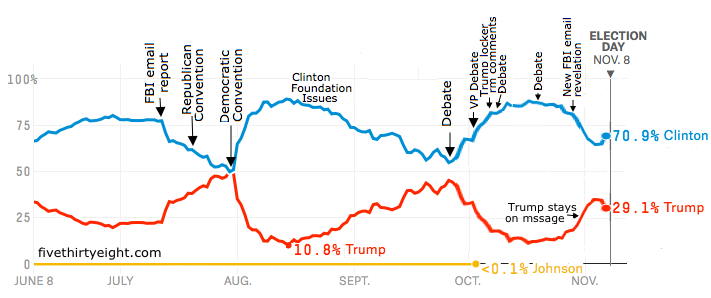
Timeline of Projections:
2016 Election Forecast | FiveThirtyEight *
Probability of winning:
Other predictive models:
                     Clinton  Trump
NY Times The Upshot  84%     16%
Huffington Post        98%      1.5%
Other Forecasts - The New York Times
Other forecasts below.
Projected popular vote:
| Date | July 31 | Aug 14 | Sept 26 | Oct 17 | Oct 28 | Nov 1 | Nov 4 | Nov 5 | Nov 7 |
| Clinton | 46.3% |
49.5% |
46.4% |
49.7% |
49.6% |
48.9% |
48.4% |
48.5% |
48.5% |
| Trump | 45.5% |
40.9% |
44.9% |
42.7% |
43.9% |
44.9% |
45.6% |
45.5% |
45.0% |
| Johnson | 7.3% |
8.3% |
7.4% |
6.1% |
|
4.9% |
4.5% |
4.5% |
4.9% |
| Clinton/Trump spread | 0.8% |
8.6% |
1.5% |
7.0% |
5.7% |
4.0% |
2.8% |
3.0% |
3.5% |
See Why Is Trump Gaining On Clinton? Sept. 8 | FiveThirtyEight
* FiveThirtyEight1 is statitician Nate Silver's web site. He has one of the best records for predicting election outcomes.
He runs simulations with election poll results weighted based on historical accuracy since 1972, sample size and other factors to determine the probability of a candidate getting the 270 electoral votes to win.
See A User's Guide To FiveThirtyEight's 2016 General Election Forecast | FiveThirtyEight
Note: Each state is given electoral college votes based on their number of congressional representatives and senators. 48 out of the 50 States award Electoral votes on a winner-takes-all basis. For example, all 55 of California's Electoral votes go to the winner of the state election, even if the margin of victory is only 50.1 percent to 49.9 percent.
Swing States or Battleground States Projected popular vote (Nov 2)*

Note: Totals don't add up to 100% because Libertarian candidate, Gary Johnson,
 (Former NM governor) is projected to get from 3% in FL to 15.6% in NM..
State        Clinton Trump   2012       2008       2004
Florida       47.9%  47.8%  Obama 50%  Obama 51%  Bush  52.1%
Nevada        46.7   46.2   Obama 52%  Obama 55%  Bush  50.4%
North Carolina  48.1   47.4  Romney 51%  Obama 50%  Bush  56.0%
Colorado      47.4   43.6   Obama 51%  Obama 54%  Bush  51.7%
New Hampshire 47.8   43.8   Obama 52%  Obama 54%  Kerry 50.2%
Pennsylvania  49.3   45.2   Obama 52%  Obama 54%  Kerry 50.9%
Wisconsin     49.3   44.7   Obama 53%  Obama 56%  Kerry 49.7
Minnesota     49.3   43.9   Obama 53%  Obama 54%  Kerry 51.1
Michigan      48.7   44.1   Obama 54%  Obama 57%  Kerry 51.2
Virginia      49.9   44.1   Obama 51%  Obama 53%  Bush  53.6
Republican
Ohio          46.0%  48.1%  Obama 50%  Obama 52%  Bush  50.8%
Iowa          45.5   47.9   Obama 52%  Obama 54%
Arizona       45.5   47.9  Romney 54%  McCain 54%
Utah          26.8   36.4  Romney 73%  McCain 63%       McMullin projected at 28.7%
Goergia       45.1   50.1
Swing States - Other models - prediction vs actual
*The percentages are based on FiveThirtyEight.com analysis of poll data.
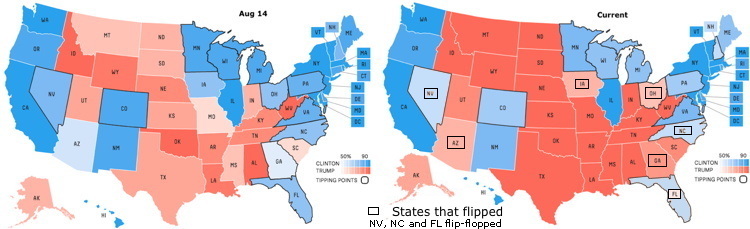 Updates in the last week before the election per 538.
Nov 3. Trump passes Clinton in FL 48.0% to 47.8%
       Trump passed Clinton in NC 47.9% to 47.8%
Nov 5. Trump passes Clinton in NV  46.8% to 46.5%
      Clinton has 291 projected Electoral votes
Nov 7  Clinton is back in the lead in NC 48.3 to 47.8%
       Clinton is back in the lead in NV 47.1 to 46.0%
       Clinton is back in the lead in FL 48.2 to 47.7%
538 has a list of "tipping point" states. That is different than swing states.
Tipping point states are determined by ranking states by projected percent of votes for the winner and determining which state will put them over the 270 Electoral College Votes (ECV) to win.
So even though Clinton has a 77% chance of winning Michigan and its 16 ECVs, it will have a higher percent of votes for Clinton than NC where she has a 50% chance of winning its 15 ECVs, so MI has a higher chance of meeting their tipping point criteria, even though NC is considered more of a swing state.
See Traditional Battleground States | 2016 Battleground-Swing States
Poll Summary at RealClearPolitics - 2016 Polls
State Poll results - Oct 6th-20th:
Clinton is/was ahead in some polls in: Ohio, Wisconsin, Florida, Pennsylvania, Virginia, Oregon, Washington, New Hampshire, Michigan, Maryland, Rhode Island, Massachusetts, North Carolina, Wisconsin, Maine, .
Trump is/was ahead in some polls in: Iowa, Alaska, Indiana, Florida, Arizona, Tennessee, Missouri, Ohio, Georgia, Utah, Lousiana, Nevada,Virginia,
National Poll results.
Note These are percentage of voters who will vote for one candidate or the other. They do reflect the number of electoral votes a candidate will get.
| Tuesday, October 4 |
| Race/Topic | Poll | Results | Spread |
| General Election: Trump vs. Clinton vs. Johnson vs. Stein | Rasmussen Reports | Clinton 42, Trump 41, Johnson 9, Stein 2 | Clinton +1 |
| General Election: Trump vs. Clinton vs. Johnson vs. Stein | NBC News/SM | Clinton 46, Trump 40, Johnson 9, Stein 3 | Clinton +6 |
| General Election: Trump vs. Clinton | LA Times/USC Tracking | Clinton 43, Trump 47 | Trump +4 |
| Monday, October 3 |
| Race/Topic | Poll | Results | Spread |
| General Election: Trump vs. Clinton vs. Johnson vs. Stein | CBS News | Clinton 45, Trump 41, Johnson 8, Stein 3 | Clinton +4 |
| General Election: Trump vs. Clinton | CBS News | Clinton 49, Trump 43 | Clinton +6 |
| General Election: Trump vs. Clinton vs. Johnson vs. Stein | CNN/ORC | Clinton 47, Trump 42, Johnson 7, Stein 2 | Clinton +5 |
| General Election: Trump vs. Clinton | CNN/ORC | Clinton 51, Trump 45 | Clinton +6 |
| General Election: Trump vs. Clinton vs. Johnson vs. Stein | Economist/YouGov | Clinton 43, Trump 40, Johnson 5, Stein 3 | Clinton +3 |
| General Election: Trump vs. Clinton | Economist/YouGov | Clinton 48, Trump 43 | Clinton +5 |
| General Election: Trump vs. Clinton | LA Times/USC Tracking | Clinton 42, Trump 47 | Trump +5 |
| General Election: Trump vs. Clinton vs. Johnson vs. Stein | Rasmussen Reports | Clinton 43, Trump 40, Johnson 8, Stein 2 | Clinton +3 |
| General Election: Trump vs. Clinton vs. Johnson vs. Stein | Rasmussen Reports | Clinton 43, Trump 40, Johnson 8, Stein 2 | Clinton +3 |
See Forecasting at Presidential Elections.
1. 538 is the number of electoral votes - 435 congressional districts plus 100 Senators plus 3 votes for DC. You need 270 votes to win.
Nate Silver is a statistician who's well known for analyzing baseball players for the Oakland A's. The movie Moneyball was about it.
Miscellaneous:
"The Nation" reported that there Are 868 Fewer Places to Vote in 2016
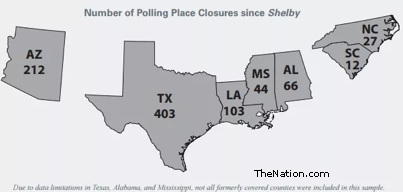 . .
In the 2013 Shelby County v. Holder case the Supreme Court gutted the the 1965 voting rights act which prohibited racial voting discrimination in 9 southern states and other municipalities. Justice Ginsburg said, "This is like throwing your umbrella away in a rainstorm because you are not getting wet."
These closures were primarily in minority districts, and will result in long lines and reduced voting turnout because of transportation problems.
Trump is right, the election is rigged, but in his favor.
GLossary:
See new words I learned during this campaign at 2016 Election Postmortem.
See also:
Election Hype
Postmortem
United States presidential election, 2016 timeline - Wikipedia
Nate Silver Is Unskewing Polls -- All Of Them -- In Trump's Direction | Huffington Post
Other forecasts:
NY Times The Upshot
Huffington Post
270ToWin.com
RealClearPolitics - 2016 Election Maps
CNN 2016 Electoral Map (Interactive)
Other Forecasts - The New York Times
Results
Return to Politics
last updated 7 Nov 2016
|
 Politics
