Health | Pandemics
Corona Virus
US Epicenters
Health | Pandemics
Corona Virus
US Epicenters
| Don's Home
Health | Pandemics
Corona Virus
US Epicenters
|
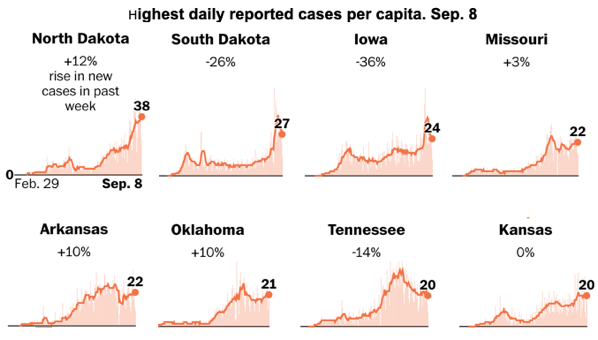
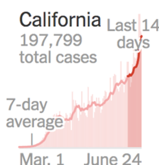
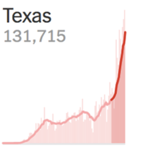
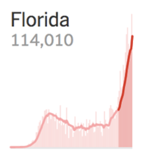
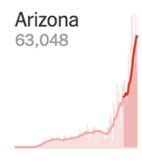
A surge after reopening in the South and Southwest changed the epicenter in July. Florida, Texas, Arizona and California accounted for 52% of all cases by July 15.
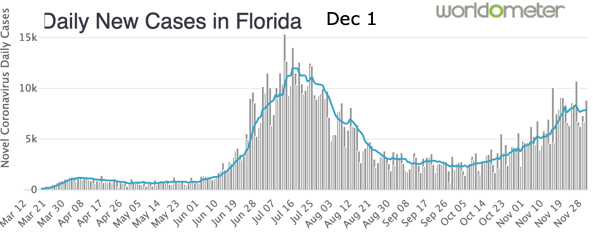
Florida Department of Health COVID-19 Outbreak
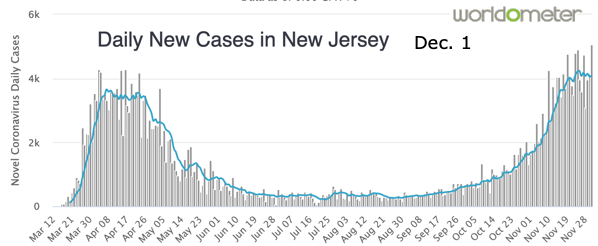
New Jersey Covid-19 Information Hub
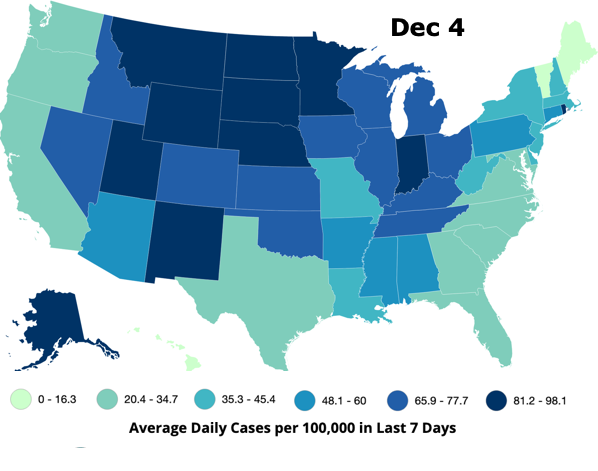
Hot Spots Bold - States 50% higher than national average thru Dec 2 and 30% higher after that.
| State | Daily New Cases per 100,000 |
|||||||||
|---|---|---|---|---|---|---|---|---|---|---|
| April Peak | July 15 | Sep. 8 | Oct. 8 | Nov 2 | Dec 2 | Jan 4 | Feb 3 | Mar 3 | Apr 3 | |
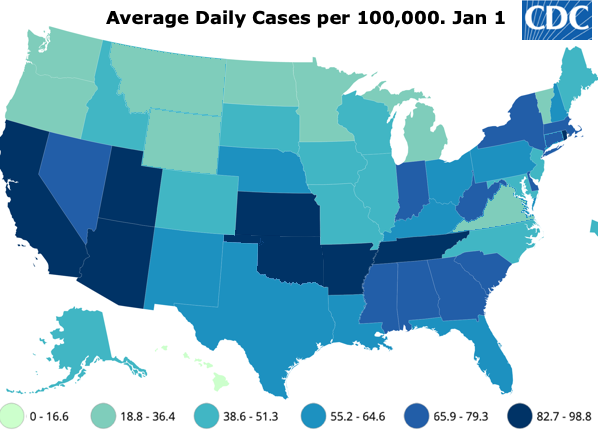
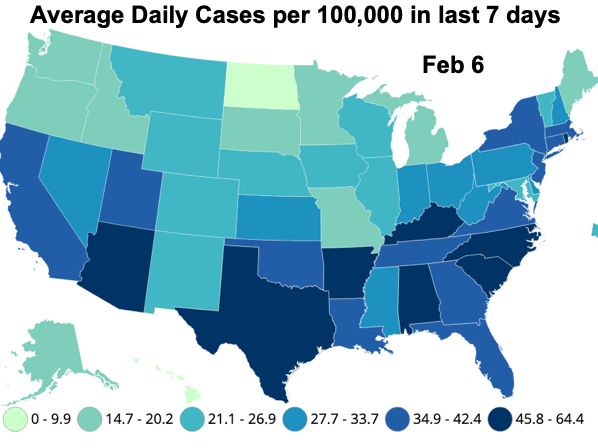
| US | 10 | 20 | 10 | 15 | 24 | 50 | 66 | 45 | 19 | 20 |
| New York | 51 | 4 | 6 | 7 | 10 | 37 | 71 | 53 | 32 | 36 |
| New Jersey | 39 | 4 | 6 | 8 | 18 | 46 | 49 | 51 | 34 | 49 |
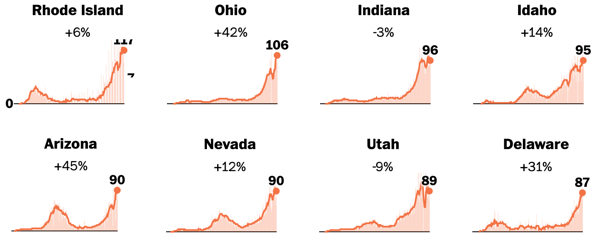
| Rhode Island | 15 | 42 | 114 | 96 | 51 | 35 | 33 | |||
| Pennsylvania | 13 | 18 | 53 | 56 | 42 | 20 | 35 | |||
| California | 3 | 20 | 11 | 8 | 10 | 37 | 96 | 42 | 11 | 7 |
| Florida | 6 | 56 | 13 | 12 | 20 | 39 | 62 | 46 | 25 | 24 |
| Arizona | 4 | 51 | 8 | 9 | 19 | 62 | 112 | 64 | 16 | 9 |
| Texas | 3 | 37 | 13 | 13 | 20 | 38 | 63 | 70 | 25 | 10 |
| New Mexico | 12 | 14 | 38 | 88 | 59 | |||||
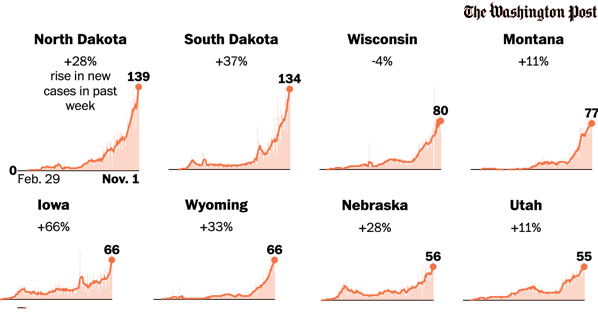
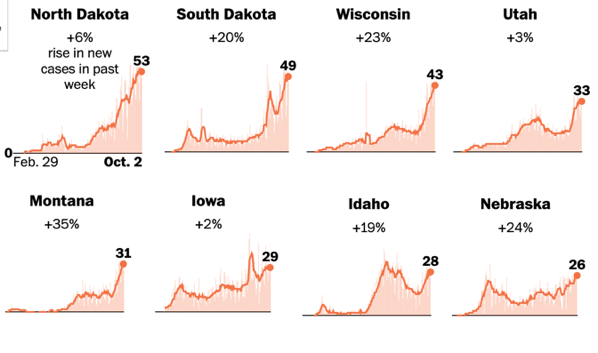
| North Dakota | 13 | 38 | 60 | 139 | 89 | 26 | 24 | |||
| South Dakota | 27 | 55 | 134 | 100 | 48 | 43 | ||||
| Idaho | 37 | 16 | 28 | 45 | 70 | 50 | ||||
| Wisconsin | 14 | 15 | 43 | 80 | 70 | 44 | ||||
| Michigan | 16 | 6 | 11 | 35 | 72 | 27 | 17 | 14 | 65 | |
| Minnesota | 12 | 20 | 46 | 115 | 34 | |||||
| Iowa | 24 | 29 | 66 | 64 | 43 | |||||
| Utah | 20 | 13 | 33 | 55 | 86 | 85 | 43 | |||
| Montana | 12 | 42 | 77 | 79 | 36 | |||||
| Nebraska | 14 | 29 | 60 | 93 | 50 | |||||
| Wyoming | 25 | 61 | 93 | 38 | ||||||
| Indiana | 18 | 44 | 87 | 71 | ||||||
| Nevada | 16 | 27 | 75 | 68 | ||||||
| Tennessee | 72 | 93 | 40 | 19 | ||||||
| Kansas | 85 | 36 | ||||||||
| Oklahoma | 84 | 52 | ||||||||
| Arkansas | 86 | 51 | 28 | 5 | ||||||
| Georgia | 17 | 30 | 80 | 51 | 28 | 12 | ||||
| South Carolina | 75 | 67 | 21 | |||||||
| North Carolina | 22 | |||||||||
| Place | Popu- lation | Cases | Deaths | Cases | Deaths | Posi- tivity Rate | % vacc- inated |
||||
|---|---|---|---|---|---|---|---|---|---|---|---|
| Total | New * | Total | New* | % of popu- lation | New /100K | Total /1M | New /1M |
||||
| Feb 1 | |||||||||||
| United States | 331,000,000 | 26,945,503 | 147,839 | 455,282 | 3,256 | 8.1% | 45 | 1375 | 9.8 | 8.0% | 9.7% |
| California | 39,510,000 | 3,328,928 | 16,355 | 41332 | 543 | 8.4% | 41 | 1,046 | 13.7 | 6.5% | 9.2% |
| South Dakota | 52% |
| Idaho | 50% |
| Kansas | 43% |
| Iowa | 39% |
| Pennsylvania | 36% |
| Alabama | 34% |
| Arizona | 30% |
| Mississippi | 24% |
| Utah | 20% |
| Tennessee | 19% |
| Missouri | 18% |
| Nevada | 17% |
| Montana | 17% |
| Arkansas | 16% |
| Oklahoma | 16% |
| Ohio | 16% |
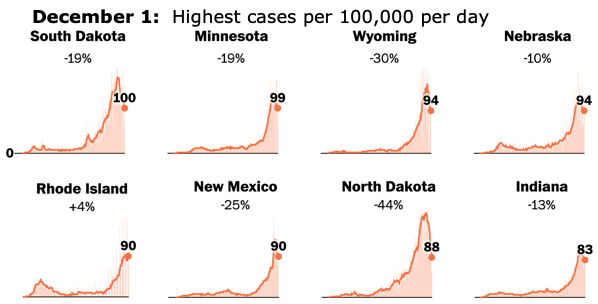
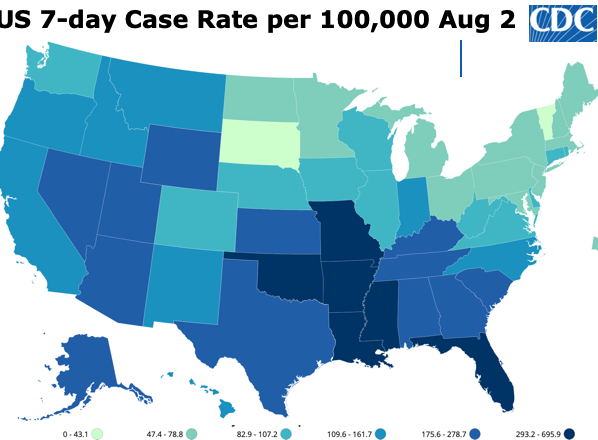
November 1: Highest cases per 100,000 per day
Coronavirus Rising in Florida, Arizona, California and Texas: What We Know - The New York Times
New Cases per million - Average per Million per day June 22 - 29
| State | popu- lation | New per 100K | Total >Cases/M |
|---|---|---|---|
| Arizona | 7.3 | 44 | 10,577 |
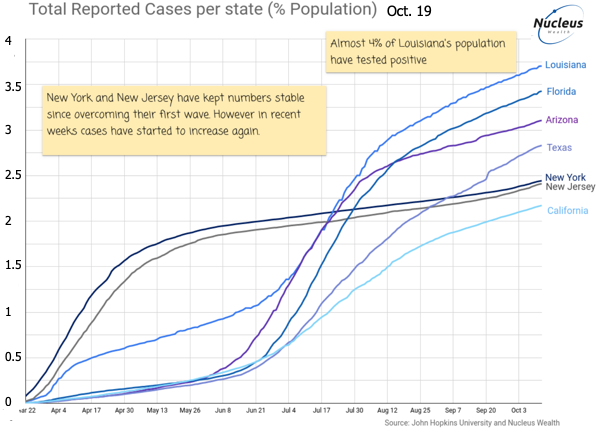
| Florida | 22 | 307 | 6,814 |
| Nevada | 3.1 | 20 | 5,809 |
| Texas | 29.0 | 20 | 5,494 |
| California | 39.5 | 14 | 5,643 |
| Illinois | 12.7 | 7 | 11,325 |
| New Jersey | 8.9 | 6 | 19,860 |
| New York | 20.1 | 4 | 21,453 |
A UC Berkeley poll released on August 5th found 80 percent of Biden voters thought the state moved too quickly to reopen businesses, while 79 percent of Trump supporters thought the opposite -- that the restrictions needed to be lifted because of the damage inflicted on the economy. Overall, 61 percent of residents said the state was too hasty in its initial reopening.
Source: Mercury News