 History
Wars, Famine, Pandemics, Natural disasters, ..
Pandemics and Epidemics
History
Wars, Famine, Pandemics, Natural disasters, ..
Pandemics and Epidemics
| Don's Home
History
Wars, Famine, Pandemics, Natural disasters, ..
Pandemics and Epidemics
| Contact |
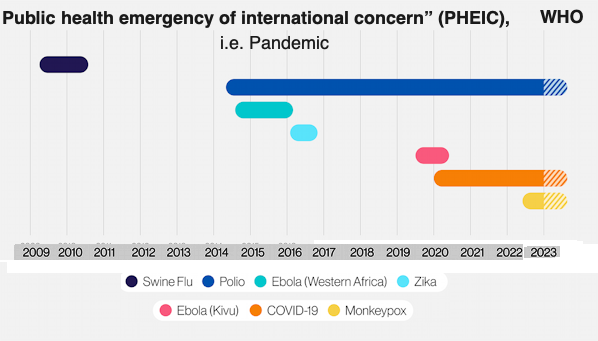
An epidemic is the rapid spread of disease to a large number of people in a given population within a short period of time.
Infectious diseases with high prevalence are not listed, such as malaria which may have killed 50-60 billion people throughout history>
| Disease | Date | World Population Billion | Infections | Deaths | Location | % Lost |
|---|---|---|---|---|---|---|
| COVID-19 | 2020-23 | 7,794 | 762M* | 7-30M † | Worldwide | 0.1% ‡ 0.33% in the US |
| Zika | 2016 | 7,464 | 51 | Worldwide | ||
| Ebola West Africa | 2014-16 | 7,300 | 11,310 | DRC, Uganda | ||
| H7N9 Bird Flu | 2013 | 7,210 | 1568 | 616 | China | |
| MERS Middle East Respiratory Syndrome, | 2012-2021 | 7,125 | 2494 | 858 | Worldwide | |
| H1N1 Swine Flu | 2009 | 6,872 | 152 K - 575 K | Worldwide | 0.004% | |
| H5N1 Bird Flu | 2003-2019 | 6,789 | 861 | 455 | China,Southeast Asia and Egypt | |
| SARS | 2002 | 6,301 | 8096 | 774 | Worldwide | |
| Nipah | 1998 | 5,984 | 513 | 398 | Malaysia | |
| Ebola | 1976 | 4,229 | 33577 | 13,562 | Sudan | |
| Marberg | 1967 | 3,478 | 466 | 373 | Angola | |
| Spanish Flu | 1918 | 1,800 | 466 | 17 - 100 M | Worldwide | 2.8% |
| HIV/AIDS 1 | 1981- present | 6,165 | 35 million | 0.6% | ||
| 3rd Plague Blubonic plague | 1855-1960 | 1,250 | 12-15M | Worldwide | 1.0% | |
| Black Death Bublonic Plague | 1346-1353 | 443 | 75-200M | Europe, Asia, andNorth Africa | 30-60% of Europe |
1. AIDS deaths are counted in various ways.
HIV, Number of people dying from HIV-related causes | WHO says 650,000 people died of HIV-related illnesses worldwide in 2021.
People dying from HIV globally in 2021 were 68% fewer than in 2004 (2 million -the peak).
Today, around 37 million worldwide live with HIV, of whom 22 million are on treatment.
Why the HIV epidemic is not over | WHO
More than 35 million people have died of HIV since the start of the HIV/AIDS pandemic.
Today, around 37 million worldwide live with HIV, of whom 22 million are on treatment.
Death rates are highest across Sub-Saharan Africa.
In 2021, South Africa, Mozambique and Nigeria had the highest number of deaths due to AIDS worldwide with around 51 thousand such deaths each.
| Virus | Data | Deaths per Infection | Infections | Deaths |
|---|---|---|---|---|
| SARS-CoV | 2002-2003 | 10% | 8,098 | 774 |
| MERS-CoV | 2012-2020 | 34% | 2,519 | 866 |
| Seasonal Flu (US) | 0.1-0.2% | |||
| Ebola | 2014-16 | 40% | ||
| Swine Flu (H1N1 variation) | 2009 | <0.1% | 1B | 151,700-575,400 |
| COVID-19 | 2020-23 | 1.2-3% | 512 M | 6-15M* |
| Disease | Virus | US Popu- lation M | Peak US New Deaths per M | Date | Months after 100th death | Total Deaths United States | Total Deaths World | Fatality Rate US1 |
|---|---|---|---|---|---|---|---|---|
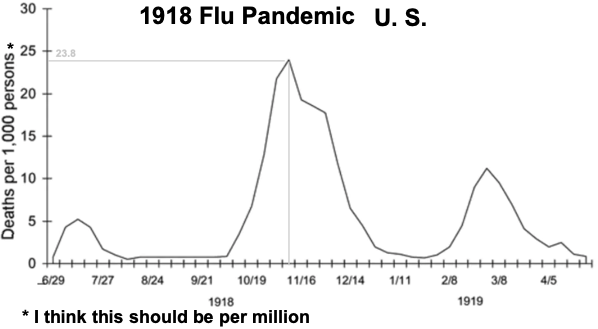
| 2018 Flu | H1N1 | 103 | 23.8 | 11/13/18 | 4 ½ | 675,000 | 17-50 M* | 0.7% |
| Novel Corona | COVID-19 | 331 | 10.5 | 01/17/21 | 10 | 1.12 million a/o 5/1/23 | 6-15 M a/o 5/12/22 | 0.3% |
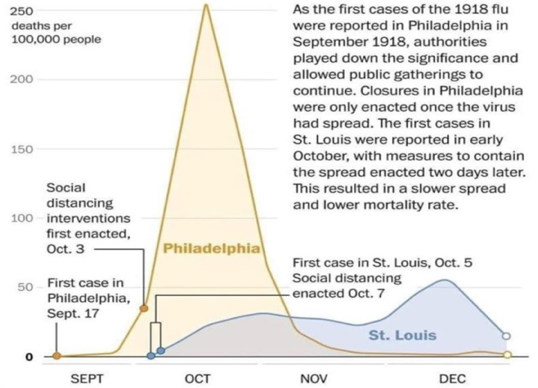
Some of the early talk about flattening the curve during COVID-19 may have came from this comparison of Philatelphia vs St. Louis during the 1918 flu.
Spanish flu: How it compares to Covid-19 coronavirus in death rate and other factors - Vox
History of 1918 Flu Pandemic | Pandemic Influenza (Flu) | CDC
Spanish Flu | Wikipedia