Health | Pandemics
Corona Virus
California
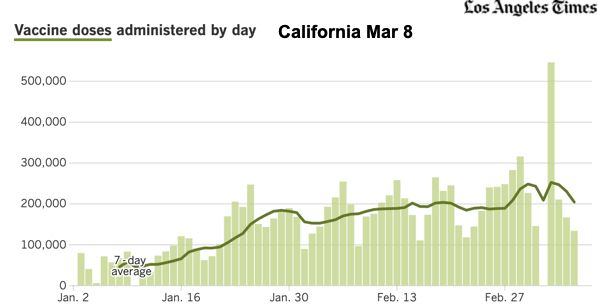
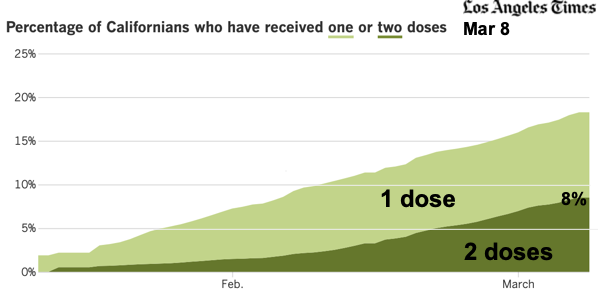
CA Vaccinations
Health | Pandemics
Corona Virus
California
CA Vaccinations
| Don's Home
Health | Pandemics
Corona Virus
California
CA Vaccinations
|
Find vaccination sites near you at vaccinateCA.org - Covid-19, Vaccine, Nonprofit
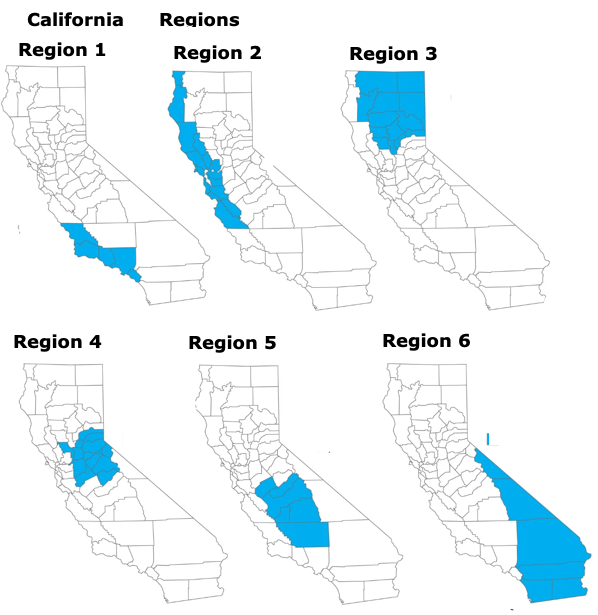
| Region | Doses Administered | |
|---|---|---|
| 1/8 | 1/16 | |
| 1 | 226,660 | 527,768 |
| 2 | 150,583 | 329,813 |
| 3 | 11,418 | 24,253 |
| 4 | 31,708 | 69,890 |
| 5 | 20,893 | 46,446 |
| 6 | 96,005 | 202,975 |
| Total | 537,267 | 1,201,145 |
| % | 1.4% | 3.0% |
| US | 12,279,180 | |
| 3.7% | ||
Find vaccination sites near you at vaccinateCA.org - Covid-19, Vaccine, Nonprofit
California Vaccination Phases
Vaccines - COVID19 Response | COVID19.ca.gov
News:
| Phase 1A | Phase 1B | Phase 1C | Phase 2 |
|---|---|---|---|
| 2.4 million people | 15 million people Note this number is much higher than a number the Governor reported on Jan 4 | 13 million people | 704 K people |
| Underway1 | Likely January - February1 | Likely March onward | Likely Summer or Fall |
|
1B Tier One:
|
|
Yolo County Vaccination Info below
As of Jan 7th California aims to immunize 1 million people within the next 10 days.
1B Tier Two will start when Tier One is completed.
Within a Tier there is no priority
There is no state registry to sign-up.
General public should coordinate with your healthcare provider.
Second shot:
Pfizer - 21 days
Moderna - 28 days
2nd shots should take presidence over 1st shots, but as of Jan. 8 there was a controversy over what to do if there is not enough doses for both.
Phase 2 tentatively scheduled for Spring.
Children:
Currently, COVID-19 vaccines are not recommended for children:
Links:
See Yolo Co below
- CA COVID-19 News on Twitter
- @GavinNewsom
- @CAgovernor
- Vaccines - When can I get vaccinated |COVID19 Response | COVID19.ca.gov
- Essential Workforce/ Essential Critical Infrastructure Workers (ECIW) lists 131 Essential Job Categories
COVID-19 Hotline 833 422-4255
Email: covidcallcenter@cdph.ca.gov
- V-safe After Vaccination Health Checker | CDC is an app that notifies you when your 2nd dose is due.
Healthcare Provider Links:
News from UC Davis Health 916 703-5555
UC Davis Health launches COVID-19 patient vaccinations (video) Jan 12.
See more UC Davis Healthcare Vaccination links.
COVID-19 vaccine | Kaiser Permanente What you need to know about the COVID-19 vaccine 866-454-8855
As of Friday 1/15 they say they are still in Phase 1A, but also include people 65 and older.
COVID-19 Vaccine Frequently Asked Questions | Sutter Health
Yolo County plans to launch an online portal to the public on the week of Jan 11 to begin the process of screening people for Phase 1B.
____________________________________________________
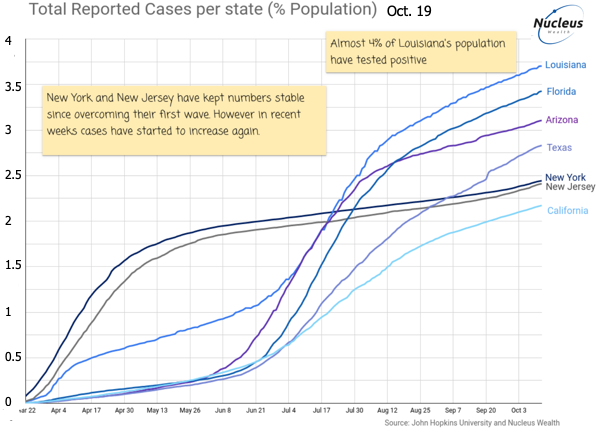
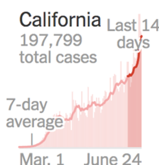
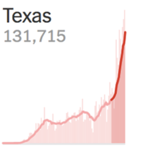
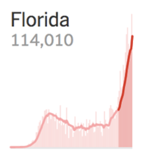
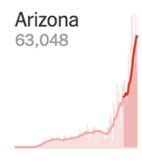
A surge after reopening in the South and Southwest changed the epicenter in July. Florida, Texas, Arizona and California accounted for 52% of all cases by July 15.
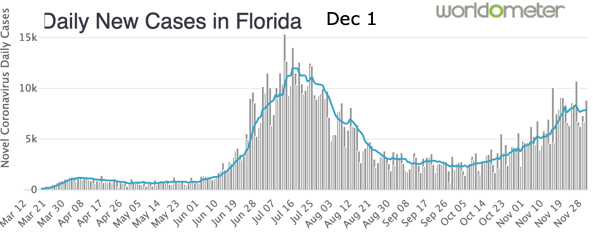
Florida Department of Health COVID-19 Outbreak
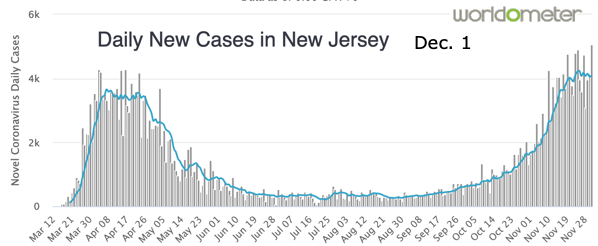
New Jersey Covid-19 Information Hub
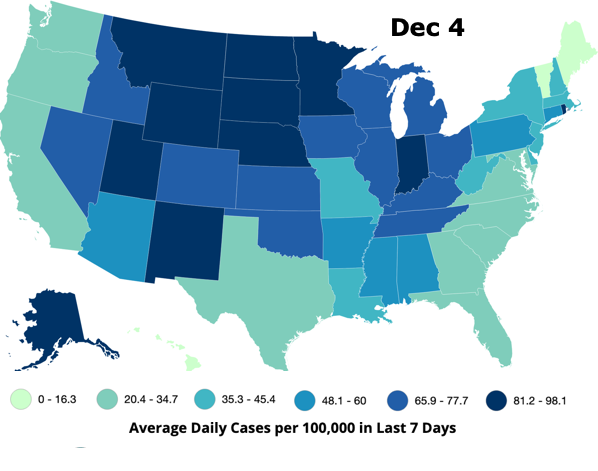
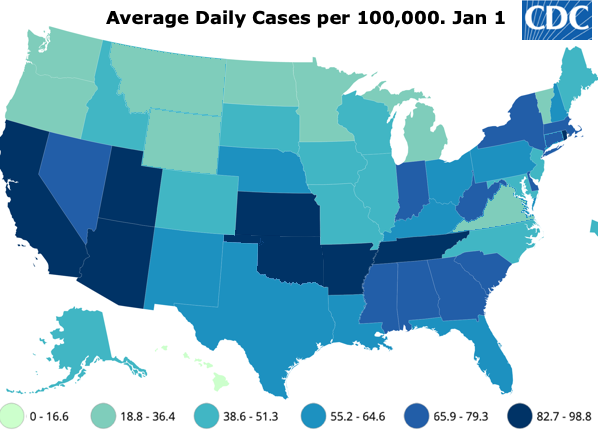
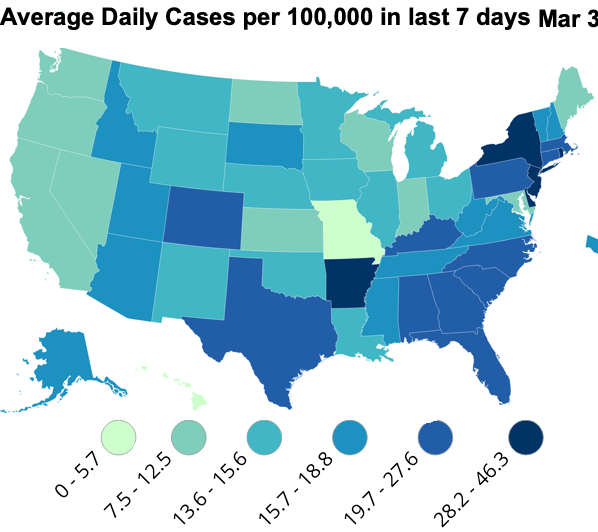
Hot Spots Bold - States 50% higher than national average thru Dec 2 and 30% higher after that.
| State | Daily New Cases per 100,000 |
||||||||
|---|---|---|---|---|---|---|---|---|---|
| April Peak | July 15 | Sep. 8 | Oct. 8 | Nov 2 | Dec 2 | Jan 4 | Feb 3 | Mar 3 | |
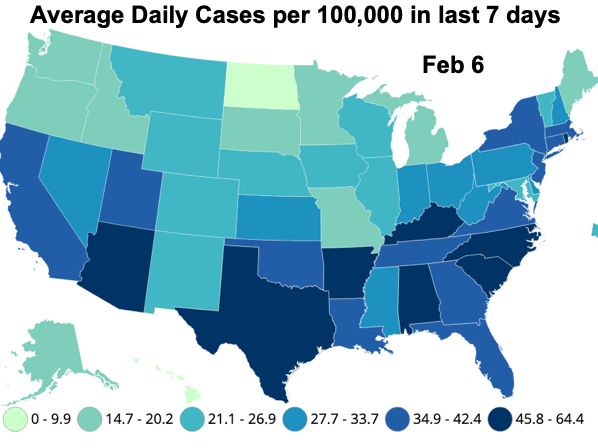
| US | 10 | 20 | 10 | 15 | 24 | 50 | 66 | 45 | 19 |
| New York | 51 | 4 | 6 | 7 | 10 | 37 | 71 | 53 | 32 |
| New Jersey | 39 | 4 | 6 | 8 | 18 | 46 | 49 | 51 | 34 |
| California | 3 | 20 | 11 | 8 | 10 | 37 | 96 | 42 | 11 |
| Florida | 6 | 56 | 13 | 12 | 20 | 39 | 62 | 46 | 25 |
| Arizona | 4 | 51 | 8 | 9 | 19 | 62 | 112 | 64 | 16 |
| Texas | 3 | 37 | 13 | 13 | 20 | 38 | 63 | 70 | 25 |
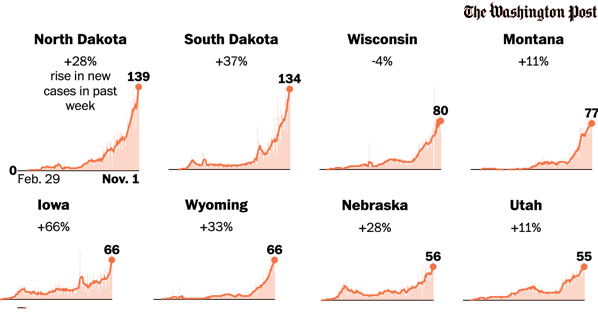
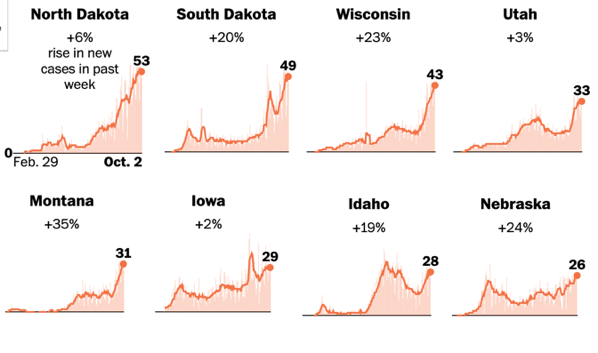
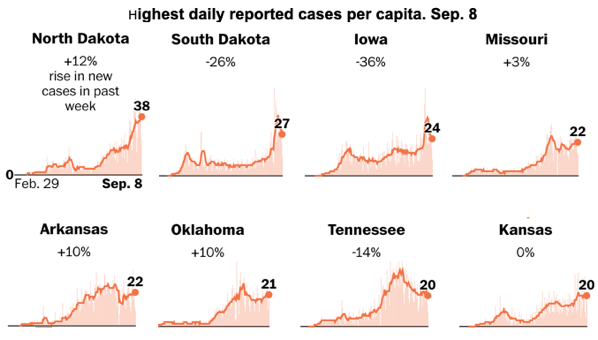
| North Dakota | 13 | 38 | 60 | 139 | 89 | 26 | 24 | ||
| South Dakota | 27 | 55 | 134 | 100 | 48 | 43 | |||
| Idaho | 37 | 16 | 28 | 45 | 70 | 50 | |||
| Wisconsin | 14 | 15 | 43 | 80 | 70 | 44 | |||
| Iowa | 24 | 29 | 66 | 64 | 43 | ||||
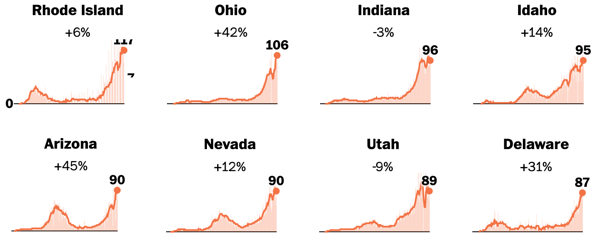
| Utah | 20 | 13 | 33 | 55 | 86 | 85 | 43 | ||
| Montana | 12 | 42 | 77 | 79 | 36 | ||||
| Nebraska | 14 | 29 | 60 | 93 | 50 | ||||
| Wyoming | 25 | 61 | 93 | 38 | |||||
| Minnesota | 12 | 20 | 46 | 115 | 34 | ||||
| Rhode Island | 15 | 42 | 114 | 96 | 51 | 35 | |||
| New Mexico | 14 | 38 | 88 | 59 | |||||
| Indiana | 18 | 44 | 87 | 71 | |||||
| Nevada | 16 | 27 | 75 | 68 | |||||
| Tennessee | 72 | 93 | 40 | 19 | |||||
| Kansas | 85 | 36 | |||||||
| Oklahoma | 84 | 52 | |||||||
| Arkansas | 86 | 51 | 28 | ||||||
| Georgia | 17 | 30 | 80 | 51 | 28 | ||||
| South Carolina | 75 | 67 | 21 | North Carolina | 22 | ||||
| Place | Popu- lation | Cases | Deaths | Cases | Deaths | Posi- tivity Rate | % vacc- inated |
||||
|---|---|---|---|---|---|---|---|---|---|---|---|
| Total | New * | Total | New* | % of popu- lation | New /100K | Total /1M | New /1M |
||||
| Feb 1 | |||||||||||
| United States | 331,000,000 | 26,945,503 | 147,839 | 455,282 | 3,256 | 8.1% | 45 | 1375 | 9.8 | 8.0% | 9.7% |
| California | 39,510,000 | 3,328,928 | 16,355 | 41332 | 543 | 8.4% | 41 | 1,046 | 13.7 | 6.5% | 9.2% |
| South Dakota | 52% |
| Idaho | 50% |
| Kansas | 43% |
| Iowa | 39% |
| Pennsylvania | 36% |
| Alabama | 34% |
| Arizona | 30% |
| Mississippi | 24% |
| Utah | 20% |
| Tennessee | 19% |
| Missouri | 18% |
| Nevada | 17% |
| Montana | 17% |
| Arkansas | 16% |
| Oklahoma | 16% |
| Ohio | 16% |
| Place | Popu- lation | Cases | Deaths | Cases | Deaths | Posi- tivity Rate |
||||
|---|---|---|---|---|---|---|---|---|---|---|
| Total | New * | Total | New* | % of popu- lation | New /100K | Total /1M | New /1M |
|||
| United States | 331,000,000 | 20,674,700 | 190,438 | 356,842 | 2,559 | 6.2% | 58 | 1078 | 7.7 | |
| California | 39,510,000 | 2,345,657 | 37,446 | 26,294 | 305 | 5.9% | 95 | 666 | 7.7 | |
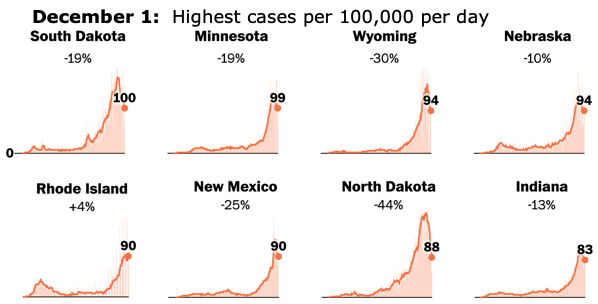
November 1: Highest cases per 100,000 per day
Coronavirus Rising in Florida, Arizona, California and Texas: What We Know - The New York Times
New Cases per million - Average per Million per day June 22 - 29
| State | popu- lation | New per 100K | Total >Cases/M |
|---|---|---|---|
| Arizona | 7.3 | 44 | 10,577 |
| Florida | 22 | 307 | 6,814 |
| Nevada | 3.1 | 20 | 5,809 |
| Texas | 29.0 | 20 | 5,494 |
| California | 39.5 | 14 | 5,643 |
| Illinois | 12.7 | 7 | 11,325 |
| New Jersey | 8.9 | 6 | 19,860 |
| New York | 20.1 | 4 | 21,453 |
A UC Berkeley poll released on August 5th found 80 percent of Biden voters thought the state moved too quickly to reopen businesses, while 79 percent of Trump supporters thought the opposite -- that the restrictions needed to be lifted because of the damage inflicted on the economy. Overall, 61 percent of residents said the state was too hasty in its initial reopening.
Source: Mercury News