 Health
COVID-19
Vaccinations - Death Rates
Health
COVID-19
Vaccinations - Death Rates
| Don's Home
Health
COVID-19
Vaccinations - Death Rates
| Contact |
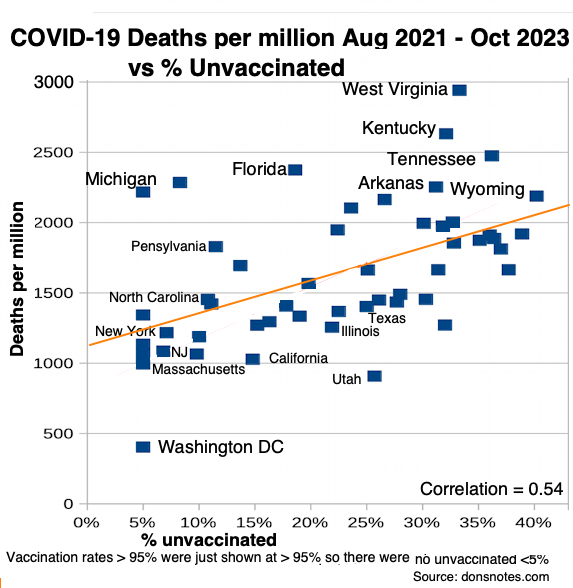
Death rate - vaccination rate chart
Death Rates since 50% of the United States had at least 1 dose of a vaccine in August 2021 plotted against the number of people with no vaccination as of October 2023, when COVID was no longer considered a National emergency.
| USA State | Cumulative 10/20/23 | Cumulative 08/01/21 | Aug ‘21- Oct ‘23 | % no vaccination |
|---|---|---|---|---|
| Alabama | 4311 | 2399 | 1912 | 36% |
| Alaska | 2030 | 540 | 1490 | 28% |
| Arizona | 4640 | 2536 | 2104 | 24% |
| Arkansas | 4389 | 2136 | 2253 | 31% |
| California | 2664 | 1636 | 1028 | 15% |
| Colorado | 2671 | 1265 | 1406 | 18% |
| Connecticut | 3465 | 2330 | 1135 | 5% |
| Delaware | 3580 | 1886 | 1694 | 14% |
| District Of Columbia | 2032 | 1629 | 403 | 5% |
| Florida | 4264 | 1890 | 2374 | 19% |
| Georgia | 4075 | 2070 | 2005 | 33% |
| Hawaii | 1452 | 387 | 1065 | 10% |
| Idaho | 3068 | 1256 | 1812 | 37% |
| Illinois | 3315 | 2059 | 1256 | 22% |
| Indiana | 3986 | 2099 | 1887 | 36% |
| Iowa | 3422 | 1968 | 1454 | 30% |
| Kansas | 3511 | 1848 | 1663 | 25% |
| Kentucky | 4294 | 1662 | 2632 | 32% |
| Louisiana | 4142 | 2478 | 1664 | 38% |
| Maine | 2337 | 673 | 1664 | 31% |
| Maryland | 2823 | 1635 | 1188 | 10% |
| Massachusetts | 3626 | 2632 | 994 | 5% |
| Michigan | 4348 | 2131 | 2217 | 5% |
| Minnesota | 2755 | 1387 | 1368 | 23% |
| Mississippi | 4527 | 2608 | 1919 | 39% |
| Missouri | 3711 | 1736 | 1975 | 32% |
| Montana | 3473 | 1619 | 1854 | 33% |
| Nebraska | 2617 | 1182 | 1435 | 28% |
| Nevada | 3948 | 2000 | 1948 | 22% |
| New Hampshire | 2296 | 1026 | 1270 | 15% |
| New Jersey | 4091 | 3005 | 1086 | 7% |
| New Mexico | 4405 | 2120 | 2285 | 8% |
| New York | 4015 | 2798 | 1217 | 7% |
| North Carolina | 2771 | 1318 | 1453 | 11% |
| North Dakota | 3298 | 2027 | 1271 | 32% |
| Ohio | 3638 | 1764 | 1874 | 35% |
| Oklahoma | 4083 | 1919 | 2164 | 27% |
| Oregon | 2263 | 696 | 1567 | 20% |
| Pennsylvania | 4021 | 2192 | 1829 | 12% |
| Rhode Island | 3933 | 2590 | 1343 | 5% |
| South Carolina | 3945 | 1950 | 1995 | 30% |
| South Dakota | 3652 | 2318 | 1334 | 19% |
| Tennessee | 4370 | 1895 | 2475 | 36% |
| Texas | 3282 | 1879 | 1403 | 25% |
| Utah | 1696 | 788 | 908 | 26% |
| Vermont | 1489 | 423 | 1066 | 5% |
| Virginia | 2782 | 1361 | 1421 | 11% |
| Washington | 2121 | 826 | 1295 | 16% |
| West Virginia | 4602 | 1661 | 2941 | 33% |
| Wisconsin | 2878 | 1429 | 1449 | 26% |
| Wyoming | 3558 | 1370 | 2188 | 40% |