last updated 22 Apr 2014
Under Construction 
 |
Global Warming
Climate Change |
 |
Global Warming | Other Fuel Problems | Renewable Energy | Technical Solutions | Energy Stats | Green Living | Green Buildings | Transportation | Geo Engineering | Greenhouse Gases | Organizations
The terms have been changing.
"Global warming" is a misnomer because it implies a gradual, uniform, & benign, rise in temperature. "Climate change" was adopted as a more appropriate term taking into account the consequences of warming, changes in the winds, the ocean currents, the storm patterns, snow packs, snowmelt, flooding, droughts and other extreme weather.
But, climate change can imply a natural process.
In 2007" Professor John P. Holdren, professor of environmental policy at the Kennedy School of Government at Harvard University and currently senior White House advisor on science and technology proposed the term "Climate Disruption". Disruption emphases the fact that it is not gradual but being accelerated by human activity.
Problem
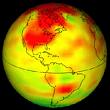
The presence of the greenhouse gases carbon dioxide (CO2), methane (CH4) and nitrous oxide (N2O) in the atmosphere causes heat from the earth which would normally be radiated out to space to be retained in the atmosphere.
Most of this increase is from Anthropogenic (derived from human activities) sources. Electrical power generation, Industrial Processes, Transportation and Agriculture account for 65% of the gasses.
See Greenhouse Gases
Science
Case for Warming
- We have had 27 consecutive years with the global average temperature greater than the 120 year historical average.
- The polar ice caps are melting.
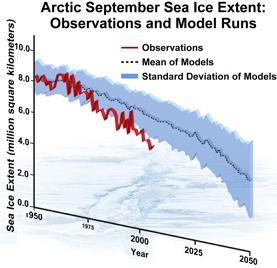 Arctic sea ice is melting at a significantly faster rate than projected by even the most advanced computer models, a new study concludes. The research, by scientists at the National Center for Atmospheric Research (NCAR) and the University of Colorado's National Snow and Ice Data Center (NSIDC), shows that the Arctic's ice cover is retreating more rapidly than estimated by any of the 18 computer models used by the Intergovernmental Panel on Climate Change (IPCC) in preparing its 2007 assessments.
Source: Arctic Ice Retreating More Quickly Than Computer Models Project at NewsWise.com, 2007.
See also: Arctic Sea Ice 2011, 2012 | Open Mind
- The four highest average world temperature years all occured within the last 6 years:
- 1998 58.17°
- 2002
- 2003
- 2001
- In 2003 Glaciers in Argentina and Chile are melting at double the rate of 1975
- Ice shelves the size of Rhode Island have broken off of Antartica since 1995.
- The Intergovernmental Panel on Climate Change's (IPCC) Fourth Assessment Report in 2007 (AR4) states that the probability of human influence on Climate Change is over 90%. See
- Temperatures are rising 3 times as fast ofer the last three decades as it did over the entire 20th century.
The IPCC's fifth Assessment Report (AR5) is being prepared in 2014.
Working group II issued their report in March: Video
The Working Group II contribution considers the vulnerability and exposure of human and natural systems, the observed impacts and future risks of climate change, and the potential for and limits to adaptation. The chapters of the report assess risks and opportunities for societies, economies, and ecosystems around the world.
It warns that the world is close to missing a chance to limit the global warming that has occurred since the Industrial Revolution.
"There is potential for crossing a threshold that leads to large system changes, and that's a very unknown world that has severe consequences," says Kelly Levin, a scientist who studies climate change impacts at the World Resources Institute in Washington, D.C.
Even at the lower end of predictions, the report warns: "Climate change will lead to increased frequency, intensity and/or duration of extreme weather events such as heavy rainfall, warm spells and heat events, drought, intense storm surges and associated sea-level rise."
See:
New Climate Change Report Warns of Dire Consequences | National Geographic
and Climate change: In the balance | The Economist
Working group III issued a report in April.
The Working Group III contribution assesses the options for mitigating climate change and their underlying technological, economic and institutional requirements.
Slow Down 1999 -
According to the Intergovernmental Panel on Climate Change (IPCC),global average temperatures have increased by around 0.05C per decade in the period between 1998 and 2012.
This compares with a decadal average of 0.12 between 1951 and 2012.
More than a dozen theories have been put forward on the cause of this pause in temperature growth that occurred while emissions of carbon dioxide were at record highs.
These ideas include the impact of pollution such as soot particles that have reflected back some of the Sun's heat into space.
Increased volcanic activity since 2000 has also been blamed, as have variations in solar activity.
The most recent perspectives have looked to the oceans as the locations of the missing heat.
A study in 2013 attributed it to a rise of cold water in the Pacific; A 2014 study in The Journal of Science, shifts the focus from the Pacific to the Atlantic and Southern oceans.
A naturally occurring 30-year cycle in the Atlantic Ocean is diverting heat into the deep seas.
This could occur for another decade,.However, they caution that global temperatures are likely to increase rapidly when the cycle flips to a warmer phase.
Source: BBC News - Global warming slowdown 'could last another decade'
Skeptics
The number of Americans who believe the earth is warming dropped from 79% in 2006 to 59% in 2011.
A Pew poll in the spring of 2011 found 75% of staunch conservatives, 63% of libertarians and 55% of Main Street Republicans said there was no solid evidence of global warming. 75% of Democrats believe there is strong evidence of climate change.
In the rest of the world, conservatives rather than posing an obstacle, are directing aggressive climate policies. In Britain, where a 2008 law required deep cuts in emissions, a coalition Conservative government is now championing a Green Deal.
Source: Whatever Happened to Global Warming? - NYTimes.com
There are still skeptics, who point to normal waraming cycles (on the order of 100,000 years) and short term (decade) cycles in the north atlantic as the reason for the current changes.
There are also warming effects from slight changes in the earth's orbit, tilt in the earth's axis and solar cycles. However, the number of skeptics is declining.
Some of their arguments:
Warming is part of a natural cycle:
There are hisorical cycles of warming and cooling (e.g. an ice age every 100,000 years):
However, the current rate of change (1°F in the northern hemisphere in the last 50 years) is much greater than any in the last 500 (some say 1,300) years.
There are several theories for these natural cycles:
One the earth's orbit is not round and we get closer to the sun every so often.
And the suns output increases every 11 years or so. However the change in solar radiation has only benn about 0.1% over the last 50 years which would not account for magnitude of the warming.
Also, the lower atmosphere (troposphere) is warming while the upper atmosphere (stratosphere) is cooler. If the sun was causing the warming both would be getting warmer.
See Global Warming Skeptics.
Intresting Plots
400,000 yrs:
This figure shows the temperature record from the Vostok ice core (dark blue), together with CO2 (red) from the Vostok ice core, the Law Dome ice core, and from the Mauna Loa monitoring station in Hawaii. The near vertical line on the right represents the change in CO2 associated with the industrial revolution.
 Source: (www.brighton73.freeserve.co.uk/gw/paleo/)
Similar chart: www.worldviewofglobalwarming.org/pages/references2.html
Al Gore shows a similar chart to the above in his 2006 movie "An Inconvenient Truth".
If you look closely the increase in greenhouse gas emissions and CO2 increases seem to lag the warming.
In the past the CO2 did not initiate the warmings, but acted as an amplifier once they are underway. CO2 stored in the deep ocean during ice ages, gets released through natural ocean currents when the climate warms. Then the greenhouse gas effect amplifies the natural warming.
See RealClimate.org.
1,000 yrs:
Source: https://www.manicore.com/anglais/documentation_a/greenhouse/rise_start.html
130 yrs:
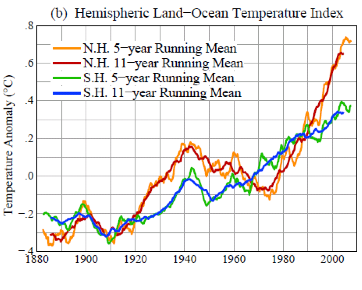
Source: If It's That Warm, How Come It's So Damned Cold?, Hansen, Ruedy, Sato, Lo
See Sources of Greenhouse Gases
More Information on Global Warming
Feb., 2007 - The UN's Intergovernmental Panel on Climate Change (IPCC) reported on their three-year study of how temperatures are likely to rise as global warming takes hold.
They adopted the Summary for Policymakers of the first volume of "Climate Change 2007", also known as the Fourth Assessment Report (AR4).
It suggests a terrifying leap in average global temperatures of up to 6.4°C - with higher figures nearer the poles - could occur over the next century,
with the most likely range of increase from 1.8°C to 4°C.
A February 3, 2007 article by The independent News/UK lists the following consequences of such temperature increases.
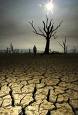
It says glacial shrinkage, ice loss and permafrost retreat are signs that climate change is already underway. Predicts higher risk of drought, floods and more powerful storms this century, increasing the probability of hunger, homelessness and water-borne disease.
Temp change ° C
 +2.4°: Coral reefs almost extinct
 +3.4°: Rainforest turns to desert
 +4.4°: Melting ice caps displace millions
 +5.4°: Sea levels rise by five metres
 +6.4°: Most of life is exterminated
Secondary Effects:
We've all heard about increased temperatures from the greenhouse effect, but there are other indirect consequences of this.
Feedback - Negative feedback has a regulating effect on systems, slowing change; positive feedback tends to exaggerate change.
- Negative feedback - good
- More Carbon Dioxide (CO2) has a fertilizing effect increasing the growth rate of plants which use CO2 in photosynthesis; The increased plant growth absorbs more CO2.
- Positive feedback - bad
- Arctic ice reflects sunlight, and heat, back into space; As it melts dark ocean and land absorbs more sunlight and heats up, causing more ice to melt.
- The frozen permafrost of Siberia and northern Canada, which lock up vast stores of carbon in the form of methane (CH4) (a greenhouse gas 20 times more potent than carbon dioxide), formed by the decomposition of organic matter. As it melts this gas is released.
The peat bogs of Siberia began to "boil" furiously in the summer of 2006 as methane bubbled to the surface.
- The oceans absorb CO2, which dissolves in seawater to form carbonic acid. It is harder for more carbon dioxide to dissolve in acid water.
- Phytoplankton, the tiny microscopic plants of the sea that form the basis of the entire marine food chain absorb carbon dioxide; They are finding it harder to live in the more stratified layers of the warmer ocean. Since 2000, when the sea surface temperatures began to rise more noticeably, the photosynthetic productivity of phytoplankton have decreased in some ocean regions by 30 per cent.
A doomsday consequence of this would be the death of the oceans.
See: Earth Emergency: This revealing film examines how human activity is setting off dangerous warming loops that are pushing the climate to a point of no return - and what we need to do to stop them. | PBS
Other effects:
The fresh water melting from the ice caps could lower the density of the water around Greenland, so it no longer sinks as it is cooled, thus and stopping the Gulf stream, which now warms Europe. And not just the Gulf Stream, but the Great Ocean Conveyor Belt, the system of interconnected ocean currents that girdle the planet. So, Europe could get colder.
See "The Science of Abrupt Climate Change" at the Weather Underground.
Glacier Melt:
In a Feb. 16, 2006 article "Greenland's glaciers losing ice at faster rate" at MSNBC is said:
"The evolution of the ice sheet, in the context of climate warming, is more rapid than has been predicted by models," one of the researchers, Eric Rignot of NASA's Jet Propulsion Laboratory, told MSNBC.com. Satellite observations indicate that Greenland's glaciers have been dumping ice into the Atlantic Ocean at a rate that's doubled over the past five years.
A Friday October 17, 2003 article in The Guardian
"Warming doubles glacier melt" said:
Glaciers in Argentina and Chile are melting at double the rate of 1975 because of global warming scientists said yesterday, after calculating that the ice lost between 1995 and 2000 was equivalent to a rise in sea level of about 0.105mm a year.
Scientists combined space observation and survey data of the 63 largest Patagonian ice fields. Comparing ice loss rates from 1968-1975 and 1975-2000 they found it had more than doubled.
The researchers, led by Eric Rignot, from the Jet Propulsion Laboratory in Pasadena, California, wrote in the journal Science that the Patagonian glaciers accounted for 9% of the glacial contribution to sea level rises, while those in Alaska were behind sea level rises of 30%. Yet in Patagonian the area covered by glaciers was five times smaller than that in Alaska.
The greater "vulnerability" of Patagonia to climate change was due to the glaciers' higher turnover rates and a "dominance of calving glaciers".
Worldwide Response:
According to "Whatever Happened to Global Warming?" - NYTimes.com Oct. 16, 2011,
"Two years ago the assumption was that the developed world would have to lead, but now China, India and Brazil have jumped in with enthusiasm, and are moving ahead."
"Buffeted by two years of treacherous weather that they are less able to handle than richer nations - from floods in India to water shortages in China - developing countries are feeling vulnerable."
Despite the recession Europe continues its yearly expansion of the carbon emissions trading system started in 2005.
A 2010 Pew survey showed that more than 70 percent of people in China, India and South Korea were willing to pay more for energy in order to address climate change. The number in the United States was 38 percent.
Sea level Rise:
According to the Union of Concerned Scientists, Sea level rise from 1880-2013 averged 8 inches. It ranged from 46 in in Grand Isle, LA to 4 in in Los Angeles.
See Sea Level Rise and Global Warming | Union of Concerned Scientists 2013
Terms:
- Anthropogenic - derived from human activities.
- AR4 4th Assessment Report from IPCC, 2007
- Carbon sequestration - the process through which plant life removes CO2 from the atmosphere and stores it in biomass.
See Sequestration below.
- CCS - Carbon Capture and Sequestration
- Climate - Generalized statement of the prevailing weather conditions at a given place.
based on statistics of a long period of time.
- Climate Disruption - Unwanted and unnatural climate change
See From Global Warming to Global Climate Disruption | Scientific Alliance
- ECO - Ecological - e.g. eco-justice, eco-climate,
- ecoclimate - climate as an influence on ecological issues
- EIA - Energy Information Administration
- GCM - general circulation model
- Geologic sequestration - a chain of activities that result in collection and transport of concentrated CO2 gas from large emission sources, such as power plants, and subsequent injection into deep underground reservoirs.
- GISS or GISSTEMP - Goddard Institute for Space Studies
- HadCRUT - Hadley Center for Climate Prediction and Research
IPCC - Intergovernmental Panel on Climate Change's
- RF - Radiative forcing - the change in net irradiance (solar plus longwave) at the tropospause. See Greenhouse gases.
- Sequestration - Capturing CO2 and putting it somewhere where it won't be released into the atmosphere.
- UAH - University of Alabama Huntsville
- Weather - The condition of the atmosphere during a brief period of time
See: Glossary here
A study published in Nature, Aug. 20, 2013, by a team of international researchers said that sea level increases of 8 to 16 inches by 2050 could cause about $60 billion in damages in 136 of the world\0xFFFDs coastal cities.
Cities whose infrastructure and buildings are most at risk today \0xFFFD including New York City; New Orleans; Miami; Guangzhou, China; and Osaka, Japan \0xFFFD will be joined in another four decades by other rapidly growing cities, such as Ho Chi Minh City in Vietnam and Abidjan, Ivory Coast.
Cost between now and 2050 (Billions)
1. Guangzhou, China  $13.2
2: Mumbai, India      $6.4
3: Kolkata, India     $3.3
4: Guayaquil, Ecuador $3.1
5: Shenzhen, China    $3.1
6: Miami              $2.5
7: Tianjin, China     $2.2
8: New York City &
   Newark, New Jersey $2.0
9: Ho Chi Minh City, Vietnam $1.9
10: New Orleans       $1.8
Feedback loops:
Positive feedback loops enhance or amplify changes; this tends to move a system away from its equilibrium state and make it more unstable. Negative feedbacks tend to dampen or buffer changes; this tends to hold a system to some equilibrium state making it more stable.
See:
Positive and Negative Feedback Loops | YouTube | Paul Andersen
There are a lot of positive feedback loops with climate change.
This can lead to an exponential increase in warming.
Global Warming Positive Feedback:
Warming is detrimental to trees which are carbon sinks (Trees use CO2 in phothensis) and take it out of the atmosphere.
- Warming is dangerous to trees:
1. They are more subject to disease (e.g. pine bark beetles) which kill them.
2. More dry and dead trees are more prone to forest fires which release CO2
-
Warming causes loss of permafrost. As it melts Methane stored below is released.
-
Oceans are an important sink for CO2
through absorption of the gas into the
water surface.
As oceans warm their ability to remove CO2 from the
atmosphere decreases.
Climate change feedback - Wikipedia
See also Cities have the most to lose from rising sea levels between now and 2050. Washington Post, Aug. 20, 2013
This seems pretty small, considering that hurricane Sandy cost NY city and NJ almost $60 billion alone.
I couldn't find data on how much of Sandy damage was due to flooding and how much from wind. And given the 14 ft storm surge in New York harbor, how much of the damage was due to the 20 inches of sea level rise on the NJ shore since 1880 and how much more damage will another foot of sea level rise cause?
See Sea Level Rise and Global Warming | Union of Concerned Scientists 2013
The sea level rise from 1880 to 2013 ranges from 4 in in Los Angeles to 4 ft. Grand Isle, LA. The rate of local sea level rise varies depending on both global and local factors, including currents,ocean \0xFFFDoor topography,
variations in ocean density, and land uplift or subsidence due to geological reasons or human activities.
A Sept. 2013 National Geographic article Rising Seas says,
"The Organisation for Economic Co-operation and Development estimates that by 2070, 150 million people in the world\0xFFFDs large port cities will be at risk from coastal flooding, along with $35 trillion worth of property"
Extreme Weather:
Scientists agree that extreme weather events will be more severe and frequent on a warming planet, and insurance companies have already documented an increase.
Global warming was blamed on the increase in hurricanes in 2005, but 2006 and 2007 have had a below average number of hurricane.
New Jersey:
NJ Climate Adaptation Alliance | Rutgers
Jersey City Residents Speak Out for Climate Action | Sierra Club
NJ Global Warming | Global Warming Response Act Recommendations Report
Climate Action New Jersey | Facebook
Organizations:
Many organizations have ideas for what you can do. You can also give money to these groups that are working for change. Consider signing up for action alerts and/or a newsletter.
Explore climate change activism and other pro-environment possibilities at these sites:

Green America
Natural Resources Defense Council
350.org
Extinction rebellion
Rainforest Action Network
Amazon Watch
Project Drawdown
Cool Effect

Top 5 Ways for the world to Fight Climate Change according to Project Drawdown

#1  Manage refrigeration chemicals
#2  Install onshore wind turbines
#3  Cut down on food waste
#4  Eat more plants and less meat
#5  Restore our tropical forests
Source: Peter Haws
Books:
Amazon.com: Global Warming: Top 15 books on the latest real science (apolitical)
A Climate for Change: Global Warming Facts for Faith-Based Decisions
Articles:
The Technology Path to Deep Greenhouse Gas Emissions Cuts by 2050: The Pivotal Role of Electricity, Science 6 January 2012:
Vol. 335 no. 6064 pp. 53-59
links:
National and World Weather cycles - trends - long range forecasts
Heating and Cooling Degree Days | Climate Change | US EPA
East Coasters, prepare for three decades of epic flooding | Grist Oct., 2014
Greenhouse Gases
IPCC Report Should Serve as 'Wake-Up Call' ABC News Sept. 2013
Political Solutions (Carbon Tax, Cap and Trade)
Whatever Happened to Global Warming? - NYTimes.com Oct. 16, 2011
Berkeley Earth Surface Temperature Project
If It's That Warm, How Come It's So Damned Cold?
Infographic: Sea Level Rise and Global Warming | Union of Concerned Scientists
These 20 cities have the most to lose from rising sea levels | Washington Post
EERE (USDE - Energy Effeciency and Renewable Energy): Consumer's Guide to Energy Efficiency and Renewable Energy Home Page
Despite Climategate, IPCC Mostly Underestimates Climate Change: Scientific American Podcast
Pew Research Center study - There has been a sharp decline over the past year in the percentage of Americans who say there is solid evidence that global temperatures are rising. And fewer also see global warming as a very serious problem - 35% say that today, down from 44% in April 2008.
Green Living (Cool Cities, Green Buildings)
Energy Statistics
Timeline
National Climatic Data Center - NCDC Climate Monitoring at NOAA
Greenhouse Gases, Climate Change, and Energy at the Dept. of Energy (DOE)
Sources of Carbon Dioxide, 1997 from the EPA
Emissions of Greenhouse Gases in the United States 2005
National Renewable Energy laboratory nrel.gov
United Nations Framework Convention on Climate Change (UNFCCC)
Greenhouse gas at Wikipedia
Climatology; Ice Ages at U. Oregon
Global Warming and Clean Energy at the National Sierra Club
TEN POPULAR MYTHS About Global Climate Change at the Sierra Club of Canada
WorldViewOfGlobalWarming.org - The World View of Global Warming project is documenting this change through science photography from the Arctic to Antarctica, from glaciers to the oceans, across all climate zones.
New Zealand national-average temperature
A Climate for Change: Global Warming Facts for Faith-Based Decisions
Global Warming Center at AccuWeather.com
Chart Of The Global Average Temperature 2500 B.C. - 2007 A.D. - 3dGameMan: Kickass Forum
Northeast Sustainable Energy Association (NESEA) - www.nesea.org
Advanced Solar Products, NJ
John Mashey's seminar on "The Machinery of Climate Anti-Science"
John Mashey replies to Peter Wood's hit piece on Global Warming
The Greenhouse Gases, Regulated Emissions, and Energy Use in Transportation
Watch 131 Years of Global Warming in 26 Seconds | Climate Central
PLOS Collections : Ecological Impacts of Climate Change
Climate change and COVID-19: Can this crisis shift the paradigm? | Berkeley News
Return to Environment
|
