|
Global Warming | Renewable Energy | Energy Stats | Green Living | Green Buildings | Transportation | Geo Engineering | Terms - Conversion factors | Electric Vehicles:
Under Construction 
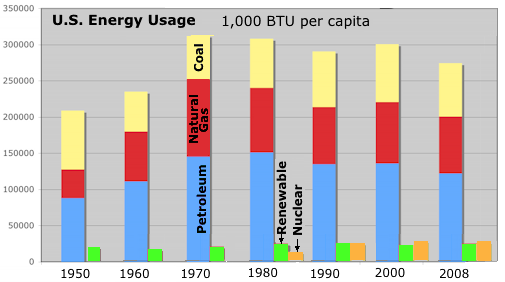
U.S. Energy Consumption per capita
| Type | % of total | Av Annual Growth |
| 1950 | 2008 | 1950-
2008 | 2000-
2008 |
| Petroleum | 38.5% | 37.4% | 0.6% | -1.3% |
| Natural Gas | 17.2% | 24.0% | 1.2% | -0.9% |
| Coal | 35.7% | 22.6% | -0.2% | -1.0% |
| Nuclear | 0.0% | 8.5% | | 0.0% |
| Biomass | 4.5% | 3.9% | 0.4% | 2.2% |
| Hydro-electric | 4.1% | 2.5% | -0.3% | -2.6% |
| Other Renewable | 0.0% | 1.0% | | 9.2% |
| 1,000 BPU per capita | 228,750 | 326,846 | 0.6% | -0.9% |
Source: EIA (U.S. Energy Information Administration)- Annual Energy Review (AER)
Table 1.3 Primary Energy Consumption by Source, 1949-2008
Chart Below
|
Total energy consumption per capita
Units: Kilograms of oil equivalent (kgoe)
| Region | 1990 | 2005 |
| Asia (excluding Middle East) | 776 | 1,052 |
| Central America & Caribbean | 1,243 | 1,366 |
| Europe | 4,080 | 3,773 |
| Middle East & North Africa | 1,185 | 1,766 |
| South America | 970 | 1,151 |
| Developed Countries | 4,756 | 4,720 |
| Developing Countries | 685 | 976 |
| High Income Countries | 4,906 | 5,524 |
| Low Income Countries | 432 | 492 |
| Middle Income Countries | 1,365 | 1,509 |
| United States | 7,700 | 7,886 |
| Japan | 3,595 | 4,135 |
Source: Total energy consumption per capita
at World Resources Institute (WRI) from the International Energy Agency (IEA)
|
See also: Oil: Crude and Petrleum Products - Energy Explained, Your Guide to Understanding Energy at DOE Energy Information Administration (EIA)
|
|
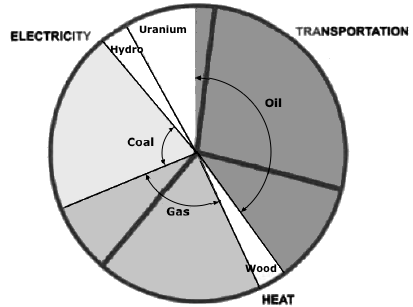
U.S. Energy usage
| Electricity | 40% |
| Transportation | 28% |
| Heat | 32% |
| Sector | 1950 | 2008 |
| Industrial | 47% | 31% |
| Transportation | 25% | 28% |
| Residential | 17% | 22% |
| Commercial | 11% | 19% |
Source: EIA Energy Consumption by Sector
|
|
Source: The bottomless well: the twilight of fuel, the virtue of waste, and why we will never run out of Energy,
By Peter W. Huber, Mark P. Mills
See also: World energy resources and consumption - Wikipedia
Industrial - Facilities and equipment used for producing and processing goods.
Commercial - Service-providing facilities and equipment (businesses, government, other institutions). [25%]
Greenhouse Gases:
Increase in Industrial Era (since 1750)
| Carbon dioxide | 35% |
| Methane | 153% |
| Nitrous oxide | 18% |
See: Greenhouse Gases
|
| Sector | % |
| Transportation | 33.0% |
| Industrial | 27.4% |
| Residential | 21.0% |
| Commercial | 18.5% |
| Total | 100.0% |
| Electric Power Generation | 47.1% |
See: Sources below
|
Source of Energy by type:
| Type | Sources % |
| Oil | Gas | Coal | Nuclear | Hydro | solar | wood |
| Electricity | 3 | 20 | 50 | 20 | 7 | .013 |
| Transportation | 97 | | | | | |
| Heating | 37 | | | | | |
Source: www.energyjustice.net/sources/
Residential Energy Sources:
| Type | 1961 | 2008 |
| Electricity | 26.9% | 68.7% |
| Gas | 36.1% | 23.1% |
| Oil | 25.0% | 5.4% |
| Coal/Peat | 5.7% | 0.0% |
| Other * | 6.3% | 2.8% |
* other includes geothermal, solar and biomass
Source:Manhattan Institute for Policy Research
Electricity Usage 2006
| Residential | 6.2% |
| Commercial | 58.9% |
| Industrial | 32.9% |
| Trans-portation | 2.0% |
Sources:
1. EIA - Electricity Basic Data from the DOE.gov
Residential Usage (one-fifth of total)
| Heating/Cooling | 42% |
| Lighting/Appliances | 36% |
| Water Heating | 14% |
| Refigeration | 9% |
Transportation:

The airlines industry consumes about
205 million tones of aviation fuel (kerosene) each year.

Gasoline	62%
Diesel	24%
Jet Fuel	8%
Natural Gas	2%
Other	4%

Personal vehicles (cars and light trucks): 63%
Cars	32%
Light Trucks	28%
Other Trucks	16%
Aircraft	9%
Boats	5%
Construction & Agriculture	4%
Pipelines	3%
Trains & Buses	3%
Source: Transportation use of Energy at eia.doe.gov 2007

From U.S. Department of Energy, Transportation Energy Data Book: Edition 26-2007.
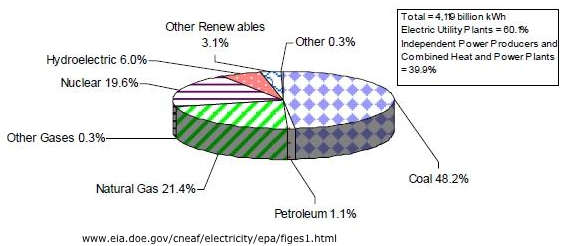
U.S. Electric Power Industry Net Generation 2008
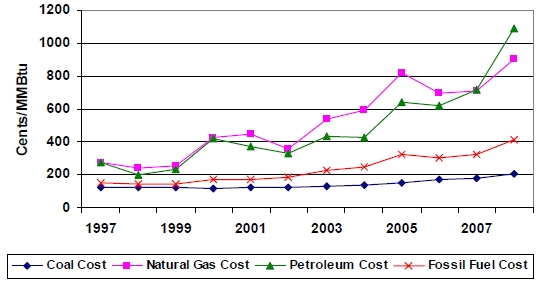
Cost of electricity (per Killowat Hour):
| Coal-fired | 3.5 to 4 ¢ |
| Natural-gas, combined cycle | 5 to 6 ¢ |
| Nuclear | 5.5 to 6.5 ¢ |
Wind in favorable areas and
up to 20 percent of the supply: | 4 to5 ¢ |
Solar
(without energy storage) | roughly 20 ¢ |
Source: Institute for Energy and Environmental Research (IEER) 2005
Source: U.S. Energy Information Administration (eia.doe.gov/cneaf/electricity/epa/)
Source of U.S. CO2 (Carbon Dioxide) Emissions (Million metric Tons)
| Type | 1990 | 2000 | P2008 | Avg. Annual Growth |
| M tons | % | M tons | % | M tons | % | 1990-
2008 | 2005-
2008 |
| Petroleum | 2,178 | 43.5% | 2,458.0 | 42.1% | 2,412.7 | 41.6% | 0.6% | -2.7% |
| Coal | 1,797 | 35.9% | 2,141.5 | 36.6% | 2,130.4 | 36.7% | 1.0% | -0.5% |
| Natural Gas | 1,026 | 20.5% | 1,234.3 | 21.1% | 1,246.9 | 21.5% | 1.1% | 1.9% |
| Total | 5,007 | | 5,844.3 | | 5,801.6 | | 0.8% | -1.0% |
| | | | | | | | |
| Sources by Sector |
| Residential | 957 | 19.1% | 1,177.5 | 20.1% | 1,221.1 | 21.0% | 1.4% | -0.9% |
| Commercial | 784 | 15.7% | 1,011.7 | 17.3% | 1,075.8 | 18.5% | 1.8% | 0.5% |
| Industrial | 1,683 | 33.6% | 1,782.6 | 30.5% | 1,587.8 | 27.4% | -0.3% | -1.7% |
| Transportation | 1,583 | 31.6% | 1,872.5 | 32.0% | 1,916.8 | 33.0% | 1.1% | -1.2% |
| Total Energy | 5,007 | 100.0% | 5,844.3 | 100.0% | 5,801.6 | 100.0% | 0.8% | -1.0% |
| Electric Power Generation | 1,815 | 36.2% | 2,294 | 45.8% | 2,359 | 47.1% | 1.5% | -0.5% |
Source: EIA - Emissions of Greenhouse Gases in the U.S. 2008-Carbon Dioxide Emissions
(eia.doe.gov/oiaf/1605/flash/excel/Flash_2008.xls)
Average Population Growth 1990-2008 = 1.1% per year
_
The combined power generating capacity of new U.S. wind turbines installed in 2009 hit more than 9,900 megawatts, up from a gain of over 8,400 MW in the previous year. Total capacity hit more than 35,000 MW, or about enough to power 9.7 million homes. This is still only about 1% of total energy used.
Source: EIA - Annual Energy Review (AER)
Table 1.3 Primary Energy Consumption by Source, 1949-2008
1998  Energy Consumption

World 12.8 TW
US     3.3 TW (26%)
We have 5% of the population but use 26% of the resources.

Source: Energy and Transportation:
        Challenges for the Chemical Sciences in the 21st Century (2003)

Transportation:
Average car in New Jersey 20 MPG 12,500 miles/year

Average Mileage
1988   26 MPG
1999   24.5 MPG

Vehicle data - Number, Miles, Fuel Consumption
U.S. Source of Oil
|
| N Amer | 18.8%
|
| Canada | 13.4%
|
| Mexico | 5.3%
|
| Middle-east | 10.7%
|
| Saudi Arabia | 6.3%
|
| Iraq | 3.0%
|
| Kuwait | 1.4%
|
| S Amer | 7.7%
|
| Venezuela | 4.8% |
| Columbia | 1.9%
|
| Ecuador | 0.6%
|
| Brazil | 0.5% |
Source: U.S. Total Crude Oil and Products Imports | eia.gov
Supply and Disposition of Crude Oil and Petroleum Products | eia.gov
Source: U.S. Product Supplied of Crude Oil and Petroleum Products (Thousand Barrels per Day)
|
| Africa | 4.6%
|
| Nigeria | 2.7%
|
| Algeria | 0.9%
|
| Angola | 0.9%
|
| Other | 3.7%
|
| Russia | 2.8%
|
| United Kingdom | 0.6%
|
| Norway | 0.3%
|
| Total Imported | 45.4%
|
| Total Domestic | 54.6%
|
|
|
Estimated energy prices by sector 2012 - 2040
Source: U. of Oslo - Energy consumption and living standard at physics.uio.no/energy/fys4540/FYS4540_slides_1.pdf
The average American uses twice the energy of the average European.
Energy Measurement:
Energy:
The metric unit for energy is the joule (J).
The english unit is British thermal unit (BTU)
1 Btu  = 1,055 J
1 joule = 1 watt (W) * 1 sec
1 MJ: one million joules
1 GJ = Giga (109) Joul
1 EJ  =  Exa (1018) Joul = 109 GJ =  .95 Quad
1 quad   quadrillion Btu   1015  Btu = 1.055 EJ
1 toe   (metric) ton of oil equivalent    39.7 million Btu = 42 GJ
1 bboe   billion barrels of oil equivalent 5.8 million Btu = 1700 kWh
1 tce   (metric) ton of coal equivalent   27.8 million Btu
 KGOE (Kilograms of oil equivalent) - 41,868 kilojoules/kg = 11.628 kWh
   Approximate amount of energy that can be extracted from one kilogram of crude oil.
1 mcf nat.gas (LHV) = 10.26 therm = 1.026 mmBtu = 1.082 GJ
1 KWh    Kilowatt-hour = 3,412 Btu

Power:
1 TW = Terra 10^12 (1 trillion) Watt = 31.5 EJ/year

Volume - weight:
bbl - Barrrel = 42 U.S. gallons
MMBbl - Million barrels
boe - Barrel of oil  equivalent = 42 U.S. gallons (35 Imperial gallons)
1.0 metric tonne (tonne) = 1000 kilograms = 2205 pounds = 7.3 barrels = 307 gallons
1.0 U.S. ton (short ton) = 2000 pounds
1.0 metric tonne (tonne) =
 L: Liter = 0.2642 gal

Number prefixes (K, M, G, ...)
ppm - Parts per million
ppb - Parts per billion

Glossary here

Energy Content (Lower Heating Values):
Crude Oil = 6.119 GJ/bbl = 5.8 mmBtu/bbl  = 39.7 mmBtu/ton
                = 145.7 MJ/gal = 38.5 MJ/L = 41.868 MJ/kg (GJ/ton)
Gasoline  = 121.8 MJ/gal = 32.2 MJ/L = 43.69 MJ/kg =115 mBtu/gal
Diesel    =  135.5 MJ/gal = 35.6 MJ/L = 41.84 MJ/kg =128 mBtu/gal
Ethanol   =    80.2 MJ/gal = 21.2 MJ/L = 26.86 MJ/kg =  76 mBtu/gal
Biodiesel = 124.8 MJ/gal = 33.0 MJ/L = 37.47 MJ/kg =121mBtu/gal
Hydrogen @ 35MPa (HHV) = 10.22 MJ/gal = 2.7MJ/L = 120 MJ/kg
UN Standard Coal = 30 GJ/ton
   Bituminous    = 27-30 GJ/ton (MJ/kg) = 25-28 mmBtu/ton
    Subbitum.    =  20-26 GJ/ton (MJ/kg) = 19-24 mmBtu/ton
         Lignite =  10-19 GJ/ton (MJ/kg) = 9-18 mmBtu/ton
Natural Gas @ STP = 37 MJ/m3  = 36mBtu/m3  = 1025 Btu/ ft3
    CNG @ 20MPa = 35.16 MJ/gal = 9.288 MJ/L = 50.04 MJ/kg
LPG@1.5MPa =88.1MJ/gal=23.3MJ/L=19.8mBtu/lb=84.5 mBtu/gal
Methanol = 63.3 MJ/gal = 16.71 MJ/L = 21.1MJ/kg = 52.8 mBtu/gal
Air-Dried (20% Moisture Content) Wood = 15 GJ/ton
Uranium = 80 GJ/g fissioned = 400 GJ/kg mined (fsnOd =.5% mnOd)
Energy GLossary Page at EIA DOE
Conversion Page
Measurement notations and abbreviations and prefixes (K, M, G, ...)
Electric Vehicles:
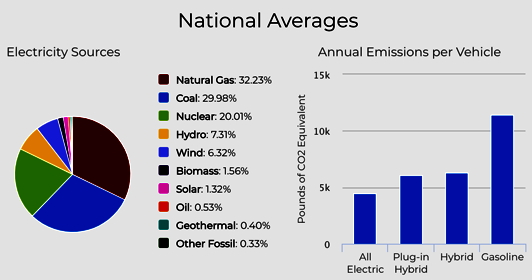
How do they determine MPG for electric cars?
The fuel economy window sticker on the 2014 Ford Focus Electric proclaims 105 "miles per gallon equivalent" (MPGe)
They calculate energy used to get this number.
1 gallon of gas will produce 115,000 BTUs (British thermal units) of energy.
To create the same amount of heat, you would need 33.7 kilowatt-hours (kWh)of electricity. So if the 2014 Ford Focus EV could travel 100 miles on 33.7 kWh of electricity (the energy equivalent of 1 gallon of gasoline), it would receive an mpg equivalency of 100 MPGe.
Note: Hybrid cars may have higher MPG ratings in stop and go (city) driving because of the regenerative braking system, which captures energy lost in breaking, using it to charge the batteries.
See also
Understanding Electric Car MPG on Edmunds.com
Gasoline gallon equivalent (GGE) or gasoline-equivalent gallon (GEG) - Wikipedia
See also Greenest cars at GreenerCars.com
Books:
Energy Myths by Max Schulz
In The Bottomless Well, Peter Huber and Mark Mills
Links:
Energy Information Administration (EIA) www.eia.doe.gov/
Energy And The Environment: Myths And Facts Update
International Energy Agency (IEA)
Intergovernmental Panel on Climate Change (IPCC)
Sunil Somalwar's Energy pages
Energy Use Data Handbook: Handbook Tables (Canada)
Total End-Use Sector
Residential
Commercial/Institutional
Transportation
Electricity Generation
s Greenhouse Gas Emissions
Energy Use in the US at Wikipedia
Home Heating Costs
Table Comparing Current 2008 Home Heating Costs for Oil, Gas, Electricity, Firewood, coal, natural gas, propane, kerosene, heat pumps in the U.S.
Energy Abbreviations Page at DOE
Energy and The Environment: Myths and Facts (www.manhattan-institute.org)) pdf
The Institute for the Analysis of Global Security - Gossary
Pollution due to land travel, air travel, and food transportation
High Oil Prices Have Significant Effects on
Consumers and the U.S. Economy at senate.gov
Most Energy-Efficient Cities
|
International
Reykjavik, Iceland.
Vancouver, Canada.
Copenhagen, Denmark. ...
Oslo, Norway. ...
London, England. ...
Malmo, Sweden. ...
Boston, San Francisco, Portland and New York.
|
U.S.
- Concord, CA
- San Jose, CA
- Sacramento, CA
- San Francisco-Oakland, CA
- Madison, WI
- San Diego, CA
- Seattle, WA
- Portland, OR
- Providence, RI
- Denver-Aurora, CO
- Los Angeles-Long Beach-Anaheim, CA
- Boston, MA
|
More City Data
Return to Environment
|
