aDeath Rate
Don's Home Reference Demographics Death Rate Contact
Under Construction
Contents: World | US | Murders| Life Expectancy
World
 Date Rate by country at: UMSL

According to the World Health Organization's 1997 World Health Report,
 life expectancy averages 64 years in the developing nations 
 and is approaching 80 years in some industrial nations.

All countries - 2002:
Rank Cause Total
(thousands)
% of total
1. Ischaemic heart disease 7,208 12.6%
2. Cerebrovascular disease 5,509 9.7
3. Lower respiratory infections 3,884 6.8
4. HIV/AIDS 2,777 4.9
5. Chronic obstructive pulmonary disease 2,748 4.8
6. Diarrheal diseases 1,798 3.2
7. Tuberculosis 1,566 2.7
8. Malaria 1,272 2.2
9. Cancer of trachea/bronchus/lung 1,243 2.2
10. Road traffic accidents 1,192 2.1%
11. Childhood diseases 1,124 2.0
12. Other unintentional injuries 923 1.6
13. Hypertensive heart disease 911 1.6
14. Self-inflicted 873 1.5
15. Stomach cancer 850 1.5
16. Cirrhosis of the liver 786 1.4
17. Nephritis/nephrosis 677 1.2
18. Colon/rectum cancer 622 1.1
19. Liver cancer 618 1.1
20. Measles 611 1.1
Source: The World Health Report, 2003, The World Health Organization (WHO).

Causes of Death for Developing Countries (1990) 1 Lower Respiratory Infections (1) 2 Heart Disease 3 Strokes & Lung Cancer 4 Diarrheal Diseases 5 Conditions During Perinatal Period 6 Tuberculosis 7 Chronic Obstructive Pulmonary Disease (2) 8 Measles 9 Malaria 10 Traffic Accidents

(1) Lower Respiratory Infections - Pneumonia, influenza and acute bronchitis, Asthma (Sometimes COPD (below) is included in lower Respiratory Infections. TB may also be included in some Stats.)

(2) Chronic obstructive pulmonary disease (COPD) is an umbrella term used to describe airflow obstruction that is associated mainly with emphysema and chronic bronchitis.

See Population Page for history of Death Rates.

USA 2019
FastStats - Deaths and Mortality
Rnk Cause Number Rate
1 Heart disease 659,041 28%
2 Cancer 599,601 25%
3 Accidents (unintentional injuries) 173,040 7%
4 Chronic lower respiratory diseases 156,979 7%
5 Stroke (cerebrovascular diseases) 150,005 6%
6 Alzheimer’s disease 121,499 5%
7 Diabetes 87,647 4%
8 Nephritis, nephrotic syndrome, and nephrosis 51,565 2%
9 Influenza and Pneumonia 51,537 2%
10 Kidney 50,046 2%
11 Intentional self-harm (suicide) 47,511 2%
12 Septicemia 38,940 2%
13 Chronic liver disease and cirrhosis 38,170 2%
14 Assault Homicide 19,727 1%
15 hypertension and hypertensive renal disease 19,054 1%


2001
Causes of Death (Rate= Deaths/100,000 pop., Rk=Rank)
Age Group All 1-4 5-14 15-24 25-44 45-64 ≥ 65
  Type Num Rate % Rk Rate Rk Rate Rk Rate Rk Rate Rk Rate Rk Rate
  . . All causes 2,417,798 849     33 . 17 . 80 . 157 . 638 . 5104
1 Heart Disease 699,697 246 29% 5 1.4 6 0.6 5 2.3 3 19 2 152 1 1654
2 Cancer 553,251 194 23% 3 2.7 2 2.4 4 4.3 2 24 1 217 2 1104
3 Stroke 163,601 57 6.8% 10 0.3 10 0.2 8 0.5 8 4 4 24 3 410
4 Chronic lower respiratory (3) 123,974 44 5.1% .. 8 0.2 10 0.4 .. 6 23 4 305
5 Medical Mistakes &
Adverse Drug Reaction
(4)
120,000   4.4%            
6 Accidents 97,707 34 4.0% 1 11.1 1 6.8 1 35 1 31 3 31 9 91
  Motor vehicle Accidents 41,967 15 1.7% . 3.9 . 4 . 26 . 16 . 13 . 20
7 Diabetes 71,252 25 2.9% ...... 9 3 5 23 6 152
8 Pneumonia and influenza 62,123 22 2.6% 6 0.7 9 0.2 9 0.5 10 2 .. 5 158
9 Alzheimers 53,679 19 2.2%         ..7 150
10 Nephritis, nephrotic syndrome, and nephrosis (Kidney disease) 39,661 14 1.6%         10 8 8 94
11 Septicemia (5) (blood poisoning) 32,275 11 1.3% 7 0.7       .. 10 72
12 Suicide 29,423 10 1.2% .. 5 0.7 3 9.6 4 13 8 14  
13 Chronic liver disease and cirrhosis 26,751 9 1.1% ...... 7 4 7 20
14 Assault (Homicide) 19,727 7 0.8% 4 2.6 4 0.8 2 13 5 11 ..
15 Hypertension (high blood pressure) and hypertensive renal (kidney) disease 19,054 7 0.8%       
16 Pneumonitis (inflammation of the lungs) due to solids and liquids 17,392 6 0.7%      
17 Parkinson's disease 16,576 6 0.7%      
18 HIV/AIDS 14,132 5 0.6%     7 0.6 6 9 9 8
19 Atherosclerosis 14,111 5 0.6%          
20 Certain conditions originating in the perinatal period 13,925 4.9 0.6% 8 0.5        
21 Other tumors (In situ neoplasms, benign neoplasms, ...) 13,673 4.8 0.6% 9 0.4 7 0.3      
22 Congenital malformations, deformations and chromosomal abnormalities 10,490 3.7 0.4% 2 3.6 3 0.9 6 1.2    
23 Other and unspecified infectious and parasitic diseases 6,266 2.2 0.3%
24 Viral hepatitis 5,094 1.8 0.2%
25 Anemias (red blood cell or hemoglobin deficiency) 4,611 1.6 0.2%
Peptic ulcer 4,462 1.6 0.2%
Nutritional deficiencies 3,725 1.3 0.2%
All 1-4 5-14 15-24 25-44 45-64 ≥ 65
Population 2000 (M) (See pop. data) 281.4 19.2 41.1 39.2 85.0 62.035.0
Source: US Deaths/Mortality and National Vital Statistics Reports - Vol. 51, No. 5 March, 2003, at the National Center for Health Statistics (HCHS) at the Centers for Disease Control CDC

(3) Chronic lower respiratory diseases include different kinds of bronchitis, emphysema (16,418), asthma, bronchiectasi and other Chronic Obstructive Lung Diseases (COLD). Sometimes refered to a Pulmonary disease.

(4) Deaths from Medical Errors and Adverse Drug Reactions are not reported as a separate category by the CDC. They categorize these deaths elsewhere (not sure where), so this total should not be added to calculate a total death rate. Dr. Mercola reports 120,000 deaths.
In its landmark 1999 report, To Err Is Human, the Institute of Medicine (IOM) asserted that between 44,000 and 98,000 people die each year in American hospitals from avoidable defects in their care.
A 1999 report by the Institute of Medicine showed that 100,000 deaaths occur in the U.S. each year as a result of health care harm.
A 2007 Center for Disease Control (CDC) report says an additional 99,000 people die annually from hospital acquired infections.
See more at Health > Medical Mistakes.

(5) Although blood poisoning can result from infected surgical incisions, wounds, or burns, other types of infection can release enough bacteria into your blood to create septicemia. Such conditions may range from urinary tract infections or pneumonia to boils and abscessed teeth or gum problems. It may precede or coincide with infections of the bone (osteomyelitis), central nervous system (meningitis), or other tissues.

Deaths per 100,000 pop.
Cause Rate
Disease 749
Medical Mistakes & adverse drug reactions   42
Other Accidents   37
Hospital acquired infections   33
Suicide   10
Homicide     6
War (1941-2004) 5.7
Natural Disaster   0.2
  Heat .051
  Flood .035
  lightning .027
  tornedo .018
  winter .014
  cold .006
  hurricane .009
  earthquake .002
Wars (1984-2004) 0.03 deaths per 100,000

Estimated risk for an American over a 50-year period.
Risk of death from botulism
1 in 2,000,000
Risk of death from fireworks 1 in 1,000,000
Risk of death from tornados 1 in 50,000
Risk of death from airplane crash 1 in 20,000
Risk of death from asteroid impact 1 in 20,000
Risk of death from electrocution 1 in 5,000
Risk of death from firearms accident 1 in 2,000
Risk of death from homicide 1 in 300
Risk of death from automobile accident 1 in 100
Source: Clark R. Chapman & David Morrison, Cosmic Catastrophes (Plenum Press, 1989)

Preventable Causes
Indirect Causes (Included in other categories above) (6)
Cause1990%2000%
Tobacco related (9) 400,000 19%435,000 18%
Obesity (8) 300,000 14%365,000 15%
Alcohol Consumption (7) 100,000 4.6%85,000 3.5%
Microbial (Infectious) agents 475,000 3.1%
Pollutants/Toxic agents 355,000 2.3%
Motor Vehicle Accidents 47,000 243,000 1.8%
Injury by firearms 228,913 1.2%
Sexual behaviors 120,000 0.8%
Drug Related 118,962 0.8%
    Suicide 16,455
    Homicide 11,001
    Accident 924
Injuries at Work 5,431 0.2%
Total 1,131,306 47%
All Deaths 2,150,0002,417,798

(6) Alcohol, drug & firearms related deaths are reported in "National Vital Statistics Reports" (see above), but are counted in other categories (e.g. firearms is lumped into all homicides, Alcohol may be included in liver disease, auto accidents, etc.) .
The CDC page with this data is no longer available but it is listed at thedoctorslounge.net/medlounge/articles/obesity_death/

(7) The "National Vital Statistics Reports" from the CDC reported Alcohol Related deaths 19,423 (0.8%) [I couldn't find what the difference between Alcohol Consumption and Alcohol Related was.

(8) Obesity = poor diet and physical inactivity. In March 2004 the Journal of the American Medical Association (JAMA) published a CDC report that said poor diet and physical inactivity caused 400,000 deaths in 2000, up from 300,000 a decade earlier, and it would surpass tobacco as the leading cause of death in 2005, but in November they reported that the study was flawed and in the January 19, 2005 issue they ran a correction in the JAMA saying the number was 365,000.
Even so Obesity deaths increased 22% from 1990 to 2000.

(9) Smoking deaths should decrease as fewer people take up smoking.
Smokers (US): 1965: 62%, 1975: 43%, 1985: 33%, 1995: 27%, 2005: 25%
Source: www.lungusa.org/atf/

See: Chronic Disease Prevention - Improving Nutrition and Increasing Physical Activity and Healthy People 2000 , Chronic Disease Overview, Chronic Diseases as Causes of Death at the CDC.

The National Cancer Institute estimates that tobacco accounts for 30% of cancers, and dietary factors account for another 35%.

See Also: CureResearch.com and Hu's Index Death Rate

US Deaths/Mortality at the National Center for Health Statistics (HCHS) at the CDC.

Cancer Deaths (US) (2001)

Rnk Type Number %
1 Lung 156,005 28%
2 Colon 56,799 10%
3 Breast 41,844 8%
4 Prostrate 30,714 6%
5 Pancreas 29,723 5%
6 Lymphoma 22,340 4%
7 Lukemia 21,518 4%
8 Ovary 14,361 3%
9 Liver 13,263 2%
Rnk Type Number %
10 Brain, Meninges 12,567 2%
11 Esophagus 12,509 2%
12 Stomach 12,340 2%
13 Blader 12,115 2%
14 Kidney 12,084 2%
15 Myeloma 11,088 2%
16 Lip, mouth 7,638 1%
17 Melanoma of Skin 7,543 1%
Other 78,800 14%
Source: National Vital Statistics Reports - Vol. 51, No. 5 www.cdc.gov/nchs/data/nvsr/nvsr51/nvsr51_05.pdf

Murders

U.S.
See World Murders below


Source: Kearl's Death Index,
FBI - Uniform Crime Reports - Crime in the United States - 2002
See: Top 25 Cities for Murder.
Terrorism, Serial Killers, Mass Murderers (Schools, Workplace, Cults, Other), Gangs and Organized Crime.

Age Statistics

Accidents and violence now account for two-thirds of all deaths of Americans one to nineteen years-of-age.
Gunshot wounds are the second leading cause of death for all people aged 10-34. National Center for Health Statistics, 1993

Death Rate by Age
Life Expectancy by Age US 2001 (All races)

A sample of developed countries

Source: National Vital Statistics Reports - Vol. 51, No. 5 from the CDC Table 1, pg. 7

Age Male Female
0 74.4 79.8
1 75 80.3
5 75.1 80.4
10 75.2 80.4
15 75.2 80.5
20 75.5 80.6
25 75.9 80.7
30 76.2 80.9
35 76.5 81
40 77 81.3
45 77.5 81.6
Age Male Female
50 78.2 82.1
55 79 82.7
60 80.1 83.4
65 81.4 84.4
70 83.1 85.7
75 85.2 87.3
80 87.7 89.3
85 90.7 91.9
90 94.2 95
95 98.2 98.7
100 102.5 102.8
See Longevity

Age men women
Expected upper
quartile *
70 84.1 89.8 86.3
80 88.1 92.0 89.6
90 94.0 95.8 94.8
95 97.8 98.3
100 102.1 102.5
* Upper quartile varies from 88 - 90.5 depending on the source.

See Actuarial Life Table | Social Security Administration (ssa.gov)

How Long Will I Live? - Life Expectancy Calculator (gosset.wharton.upenn.edu) uses various paramaters (parents disease history, life style, ...) to compute your life expectancy.
At age 70 life expectancy varied from 82.5 to 87.9 depending on the variables.
Smoking took off 2 years, exercise gained 1.3 years, bad diet took of .7 yrs.

Upper, middle, & lower quartiles of life expectancy | Andreoli and Carpenter's Cecil Essentials of Medicine
Note: The above tables give lower upper quartile than the wharton calculator.

It varies by state:
State Life Tables | Center for Disease Control Some examples.

Hawaii         80.23     Florida              78.10
Minnesota      79.26     New Jersey           77.58
California     78.80     U.S. Average         76.83
New Hampshire  78.79     North Carolina       76.27
Massachusetts  78.76     Mississippi          73.88
Colorado       78.72     District of Columbia 73.09
Arizona        78.15
 

Trends over Time

The life expectancy at birth in the US has risen from 47 years in 1900 to 77 years in 2000.

Source: Institute for Public Administration at U. Delaware

See the Population Page for.
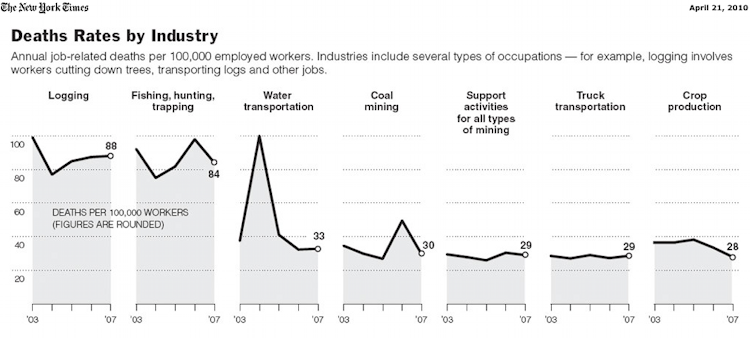
The increases from 1900 to 1950 were primarily due to reduced infant mortality; in 1900 20% died before the age of 10, in 1940 it was reduced to 10%. (The cause may be more to increased living standards, education and lower birth rates than to medical care) and infectious disease control from antibiotics, and public health improvements such as pasteurized milk, clean water, etc.
The increases from 1960 to 2000 had more to due with the older population and improved cardiovascular disease treatments. Infant mortality reduction continued to to better treatments for premature (low birth weight) babies.
See: The Production of Health at the Institute for Public Administration at U. Delaware.


Accidents and violence now account for two-thirds of all deaths of Americans one to nineteen years-of-age.

Most dangerous occupations:
Source: Where Running for Cover Is Part of the Job - NYTimes.com

International Data


See: Human population growth and the demographic transition | Philosophical Transactions of the Royal Society B: Biological Sciences

The Boston College Report Why is life expectancy so low in the US says of the low US expectancy:
"The obesity rate appears to be a key factor. Among Organization for Economic Cooperation and Development (OECD) countries, the United States had the highest obesity rate for men (28%) and the second highest for women (34%) in 1999. The median rates were 12% for men and women. Japan had the lowest rates 4% of women and 2% of men are considered obese"

Life Expectancy at birth - (sample of developing countries) 2014 est.
Country Men Women
Peru 68.1 72.8
China 68.6 71.5
Fiji 64.2 69.1
Honduras 63.2 66.3
Brazil 59.3 69.0
Russia 58.8 71.7
Country Men Women
India 62.5 64.3
Indonesia 60.7 65.3
Pakistan 58.5 60.3
Nepal 58.5 58.4
Zambia 36.7 37.2
Malawi 36.5 36.1
See: , CIA World Factbook and photius.com summary of CIA WFB

Life Expectancy at birth
rank Country Years
3 JAPAN 84.46
8 SWITZERLAND 82.39
10 AUSTRALIA 82.07
11 ITALY 82.03
12 SWEDEN 81.89
14 CANADA 81.67
15 FRANCE 81.66
17 NORWAY 81.6
18 SPAIN 81.47
19 ISRAEL 81.28
22 NETHERLANDS 81.12
26 NEW ZEALAND 80.93
27 IRELAND 80.56
28 GERMANY 80.44
29 UNITED KINGDOM 80.42
30 GREECE 80.3
32 AUSTRIA 80.17
35 EUROPEAN UNION 80.02
37 BELGIUM 79.92
38 TAIWAN 79.84
39 KOREA, SOUTH 79.8
41 FINLAND 79.69
42 UNITED STATES 79.56
47 DENMARK 79.09
48 PUERTO RICO 79.09
49 PORTUGAL 79.01
52 CHILE 78.44
56 PANAMA 78.3
57 BRITISH VIRGIN ISLANDS 78.29
58 COSTA RICA 78.23
59 CUBA 78.22
sources:
CIA World Factbook
Life Expectancy | Organisation for Economic Co-operation and Development (OECD.org)
 
A 2000 World Health Organization (WHO) report calculated healthy life expectancy for babies born in 1999 based upon an indicator developed by WHO scientists, Disability Adjusted Life Expectancy (DALE). They say:
"In terms of DALE, the top 10 nations are Japan, 74.5; Australia, 73.2 years; France, 73.1; Sweden, 73.0; Spain, 72.8; Italy, 72.7; Greece, 72.5; Switzerland, 72.5; Monaco, 72.4; and Andorra, 72.3.
The US ranked 24th with an average of 70 years of healthy life.
They attribute this to:
  • In the United States, some groups, such as Native Americans, rural African Americans and the inner city poor, have extremely poor health, more characteristic of a poor developing country rather than a rich industrialized one.
  • The HIV epidemic causes a higher proportion of death and disability to U.S. young and middle-aged than in most other advanced countries. HIV-AIDS cut three months from the healthy life expectancy of male American babies born in 1999, and one month from female lives;
  • The U.S. is one of the leading countries for cancers relating to tobacco, especially lung cancer Tobacco use also causes chronic lung disease.
  • A high coronary heart disease rate, which has dropped in recent years but remains high;
  • Fairly high levels of violence, especially of homicides, when compared to other industrial countries.

Real Age.com - Uses factors such as general health, lifestyle, medical conditions, diet and nutrition, stress, and exercise to determine your life expectancy.

See: World life expectancy charts at M White's site.

World Murder Rate by Region
Murder Rates by Region of the World
Sources: UN Crime Trends Survey and Interpol, 2002 or most recent year.

Accidents
See Accident Page


See: See Causes of Death at UKY,
Cure Research, Death Toll from Disasters, War
Death Rates at: DisasterCenter.com Hu's Index Death Rate
World Population Growth.
US Deaths/Mortality at the National Center for Health Statistics (HCHS) at the CDC.
"Worldwide Study Finds Big Shift in Causes of Death" LA Times, 1996
Transportation Death Rate (Auto, Train, Plane)

Prevention

Auto Accidents
1/3 of all accidents occur at intersections.
See VEHICLE & ROAD SAFETY at State Farm.
From: http://environmentalet.hypermart.net/env1100/populationproblems.htm Stress
I mentioned above that in post-industrial society, population stress outweigh starvation and infectious disease as a mortality factors problems with violence and psychological/physiological freakout can be seen in rats that are overcrowded in the lab.

a. Environmental influences

  • the major causes of death can be related to chemical, social, and emotional stress
  • the crowding, noise, odor, and grime of cities is thought to be depressing
  • the lack of stable social structure (ie, loss of values or norms) is also thought to be disruptive to peoples mental equilibrium
  • rapid change in the social and physical milieu is also stressful
  • something as simple as the biannual daylight savings time shift has been shown to significantly increase accidents and mortality
b. Physiological effects
  • some have attributed the high rates of cardiovascular disease to a lack of physiological outlets for fight-or-flight stress responses
  • certainly there are chemical insults in the environment (including self-inflicted chemical insults such as poor diet, cigarettes and other drugs) that contribute to heart disease and cancer
  • did anyone hear about the recent report that TSP is responsible for higher death rates in air polluted areas?

Return to Reference
last updated 11 Apr 2005