 Politics
Presidential Elections
2024 Polls
Politics
Presidential Elections
2024 Polls
| Don's Home
Politics
Presidential Elections
2024 Polls
|
Contents: Polling: | Outcome forecast | Beting on the outcome | Undecided Voters Could Make the Difference | Ethnic Community inflence | My speculation | Polling methods and accuracy | Ethnic Community inflence: | Links:
I'll post the demographics at 2024-Results when all the counting is done.
A month ago I posted in My speculation below.
"In my humble opinion I'm afraid that biases, misogyny and xenophobia may have more to do with the outcome than democracy, the economy, immigration, abortion, international relations and other real issues."
I still think that had a big part to palay, but it was just one piece of the puzzle which I don't understand.
The underestimate for Trump could be for several reasons.
1. Higher turnout for young voters and their shift from traditional democratic bias to conservatives.
2. People don't answer polls or lie if they are voting for Trump.
In 2012 (Obama vs Romney) Obama did better than the polls.
In 2016 Polls gave Clinton a 4 to 6 point lead but she lost to Trump by 2 points.
In 2020 polls had Biden with an 8 point lead but he won by 4.4 points.
One explanation is that people who are going to vote for Trump either don't answer polls or lie.
See more on polling methods and accuracy below.
Polling:
Poll aggravators: They average polls from other sources.
270toWin and the Washington post both average multiple polls.
Below is the results for battleground states
270toWin averaged 5 to 11 polls in each state. (varies by state)
Battleground States
Note: If you adjust by the amount Trump was undercounted in
the 2020 polls, he would be ahead in all races.
Sorted by Electoral votes
The Blue Wall
The blue wall refers to the collection of states that had reliably voted Democrat in recent presidential elections through 2012. In a surprising victory, former President Donald Trump flipped three blue wall states in 2016: Pennsylvania, Michigan and Wisconsin. President Joe Biden won them back in 2020.
The three states account for 44 electoral votes, a large chunk of the 93 electoral votes that the seven battleground states make up.
| Area | Electoral Votes | Oct 5 | Oct 11 | Oct 21 | Oct 30 | Nov 4 | Wash Post Nov 4 | |||
|---|---|---|---|---|---|---|---|---|---|---|
| Harris | Trump | 270toWin | 2024 Average | 2 week shift |
||||||
| National | 49.6% | 46.4% | Harris 3.2% | Harris 1.3% | Harris 1.3% | Harris 0.9% | Harris 1.2% | Harris +2 | ||
| Pennsylvania | 19 | 48.4% | 47.9% | Harris 0.5% | Trump 0.1% | Trump 0.3% | Trump 0.6% | Tie | Harris <1 | Trump +0.5 |
| North Carolina | 16 | 48.4% | 49.2% | Trump 0.8% | Trump 1.6% | Trump 0.4% | Trump 1.4% | Trump 1.3% | Trump <1 | Harris +0.1 |
| Georgia | 16 | 48.4% | 49.4% | Trump 1% | Tie | Trump 1.9% | Trump 2% | Trump 1.2% | Trump +2 | Trump +0.3 |
| Michigan | 15 | 48.4% | 47.4% | Harris 1% | Harris 0.1% | Trump 0.4% | Harris 1.9% | Harris 1.8% | Harris +2 | Harris +0.2 |
| Arizona | 11 | 47.9% | 48.8% | Trump 0.9% | Trump 1.7% | Trump 1.8% | Trump 2.2% | Trump 1.7% | Trump +2 | Trump +0.4 |
| Wisconsin | 10 | 49.3% | 48% | Harris 1.3% | Harris 0.3% | Harris 0.5% | Harris 0.7% | Harris 1.1% | Harris +2 | Harris +0.5 |
| Nevada | 6 | 49.6% | 47.4% | Harris 2.2% | Trump 0.6% | Trump 0.6% | Trump 0.4% | Trump 0.6% | Harris +1 | Harris +0.8 |
| Nebraska * Distr. 2 Omaha | 1 | Harris was up 8-10% in the 2 most recent polls on November 4th | ||||||||
| Iowa | 6 | Over the last weekend Iowa has become a swing state. They voted Republican in 2016 and 2020, but went Democratic in 2008 and 2012. A Des Moines Register/Mediacom Iowa Poll on Nov. 2 shows. Harris leads Donald Trump in Iowa 47% to 44%, 270toWin still has Iowa for Trump 4.7% and Silver has Trump 4.4% | ||||||||

The above chart appears to be based on polls.
A copule of interesting scenarios:
Following is my simple calculation based on 2 scenarios.
Silver has a complicated model to predict the outcome of the election based on thousands of scenarios. See Below.
In the safe states Democrats have 225 electoral votes, Republicans have 219. Battleground states have 94.
So if Harris could flip Pennsylvania and hold Michigan, Wisconsin and Nebraska Dist 2 she would have 225+19+15+10=270 electoral votes (The mininum to win), Trump would have 219+16+16+11+6=268 electoral votes.
If Trump got Nebraska District 2 it would be a tie, 269 to 269..
In case of a tie each state would get 1 vote determined by the new house members in that state, so there are more states dominated by democrats, so Trump would win.
National Polls
In 2016 and 2020 the winner did not win the popular vote because of the way the electoral college works. Clinton had 48.2% of the popular vote and Trump had 46.1% in 2016. Democrats do very well in large states like New York and California, but the large margin doesn't help becasuse you get the same number of electoral votes whether you win by 30% or 3%.

See Presidential Elections for historic results by state.
In 2016 and 2020 the election winner did not win the popular vote because of the way the electoral college works. Clinton had 48.2% of the popular vote and Trump had 46.1% in 2016. Democrats do very well in large states like New York and California, but the large margin doesn't help becasuse you get the same number of electoral votes whether you win by 30% or 3%.


His recent election forecasting systems predicted the outcome of the 2012 and 2020 presidential elections with a high degree of accuracy. In 2016, his polls-only model gave Donald Trump, the ultimate winer, only a 28% chance of victory, although this was higher than any other forecasting competitors. He created his own election forecasting company Silver Buklletin in 2023 .
538
October 30: Harris 48.0% Trump 46.8%
The Economist
October 30: Trump 51% Harris 48%
Allan Lichtman's 2024 presidential election prediction. | ABC News
He predicts Harris will win.
Historian Allan Lichtman has accurately predicted the outcome of 9 out of the last 10 presidential elections, and he's done it without the use of polling data. Instead, he uses a set of 13 keys to make his predictions.
The keys include whether:

NY Times article on October 4 says 17% are undecided.
Donald J. Trump and Kamala Harris are starkly different presidential candidates. So why are so many voters - roughly 1 in 6 are still unsure of their choice?

Source: State of the Election | Vox Sept., 3
Oct 2 - A new national poll from Ipsos (A Public Opinion Specialist) found that former President Trump has the edge among undecided likely voters who do not support him or Vice President Harris. Ipsos found that when undecided likely voters are forced to pick a candidate, 53 percent of them chose Trump while 35 percent selected Harris. Another 15 percent skipped the question all together.
In Pennsylvania Ukrainian American are voting for Harris because Trumps position on support for Ukraine's war with Russia.
Polish people in Pennsylvania are not supporting Trump because of his relationship with Vladimir Putin, who is a feared danger for Poland.
Hispanics increase support of Harris after speakers remarks about Puerto Rico at Trump Madison Square Garden rally.
A 2020 report complicates simplistic narratives about race and the 2020 election |VOX
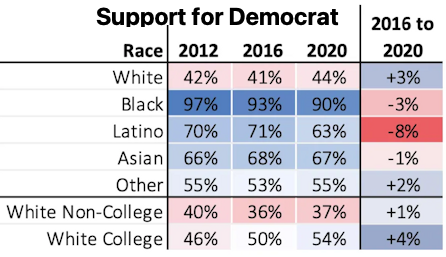
Why Latinos are turning to the Republican Party | CNN says,
"As Latinos settle and integrate, fewer are likely to think of themselves as immigrants, and may increasingly embrace an expanded sense of White identity in the way earlier light-skinned ethnic groups have over the course of US history."
The resons Democrats are loosing black support are more complex.
The support by younger backs is the thing that stands out. In the 18-29 age groups 62% lean Republican while 38% lean Democratic.
The reasons Democrats are loosing black support are more complex.
The support by younger backs is the thing that stands out. In the 18-29 age groups 62% lean Republican while 38% lean Democratic.

Religion 2024

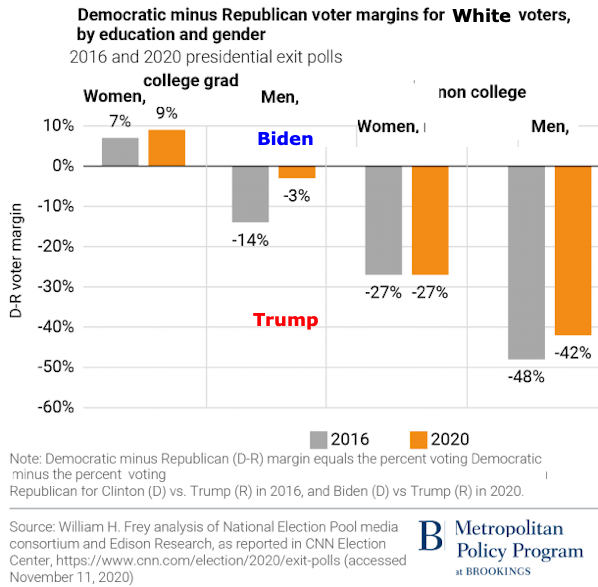
Gender Education 2016-2020:

My speculation:
In my humble opinion I'm afraid that biases, misogyny and xenophobia may have more to do with the outcome than democracy, the economy, immigration, abortion, international relations and other real issues.
On the other hand I wonder if it will be like 1964 (Lyndon Johnson vs Barry Goldwater) where there was a big difference between the candidates in a lot of ways.
A History article "How Barry Goldwater Brought the Far Right to Center Stage in the 1964 Presidential Race" says,
"Goldwater was, without doubt, a divisive figure: Democratic detractors like Martin Luther King. Jr. and then-California Governor Pat Brown had compared his blunt, pull-no-punches rhetoric to Hitler. Within his own party, moderates responded with varying degrees of dismay or horror to his policies. On the eve of the 1964 GOP convention, the Republican governor of Pennsylvania, William Scranton, publicly released a letter he had written to Goldwater decrying the latter's "crazy quilt" of "dangerous positions," including his casual attitude toward the use of nuclear weapons."
LBJ won in a landside with 44 states and 486 electoral college votes..
There were only 6 states which went Republican, Alabama, Arizona, Georgia, Louisiana, Mississippi and South Carolina. because of, when it's usually around half.
in 2016 Trump won with 30 states and 279 electoral college votes.
Was 2016 and this year, as Yogi would say, Deja vu all over again?
Unfortunately it looks like No.
But this resulted in a pivotal change in American politics. The southern Democrats were the conservative power ever since they would not become Republicans because of Lincoln.
The South became Republican because of Goldwater.
Polls predicted a Clinton had a big advantage over Trump in 2016
In 2020 polls gave Biden a 4 point lead when actually won by 1.
In the 2022 midterms the democrats did better than the polls predicted.
Most sample sizes are around 1,000 up to 2,500 for NYT/Siena College.
Some history for Pennsylvanie from the Washington Post.
How the polls performed in Pennsylvania in previous elections
| Election | Final poll avg. (PA) | Actual result (PA) | Polls underestimated |
|---|---|---|---|
| 2020 | Biden +4 | Biden +1 | Trump by 3 |
| 2016 | Clinton +4 | Trump <1 | Trump by 5 | >
| 2012 | Obama +6 | Obama +5 | Negligible miss |
Polling Errors The Economist:

Polls have a history of being wrong: