 Places
California
Politics
Places
California
Politics
| Don's Home
Places
California
Politics
|
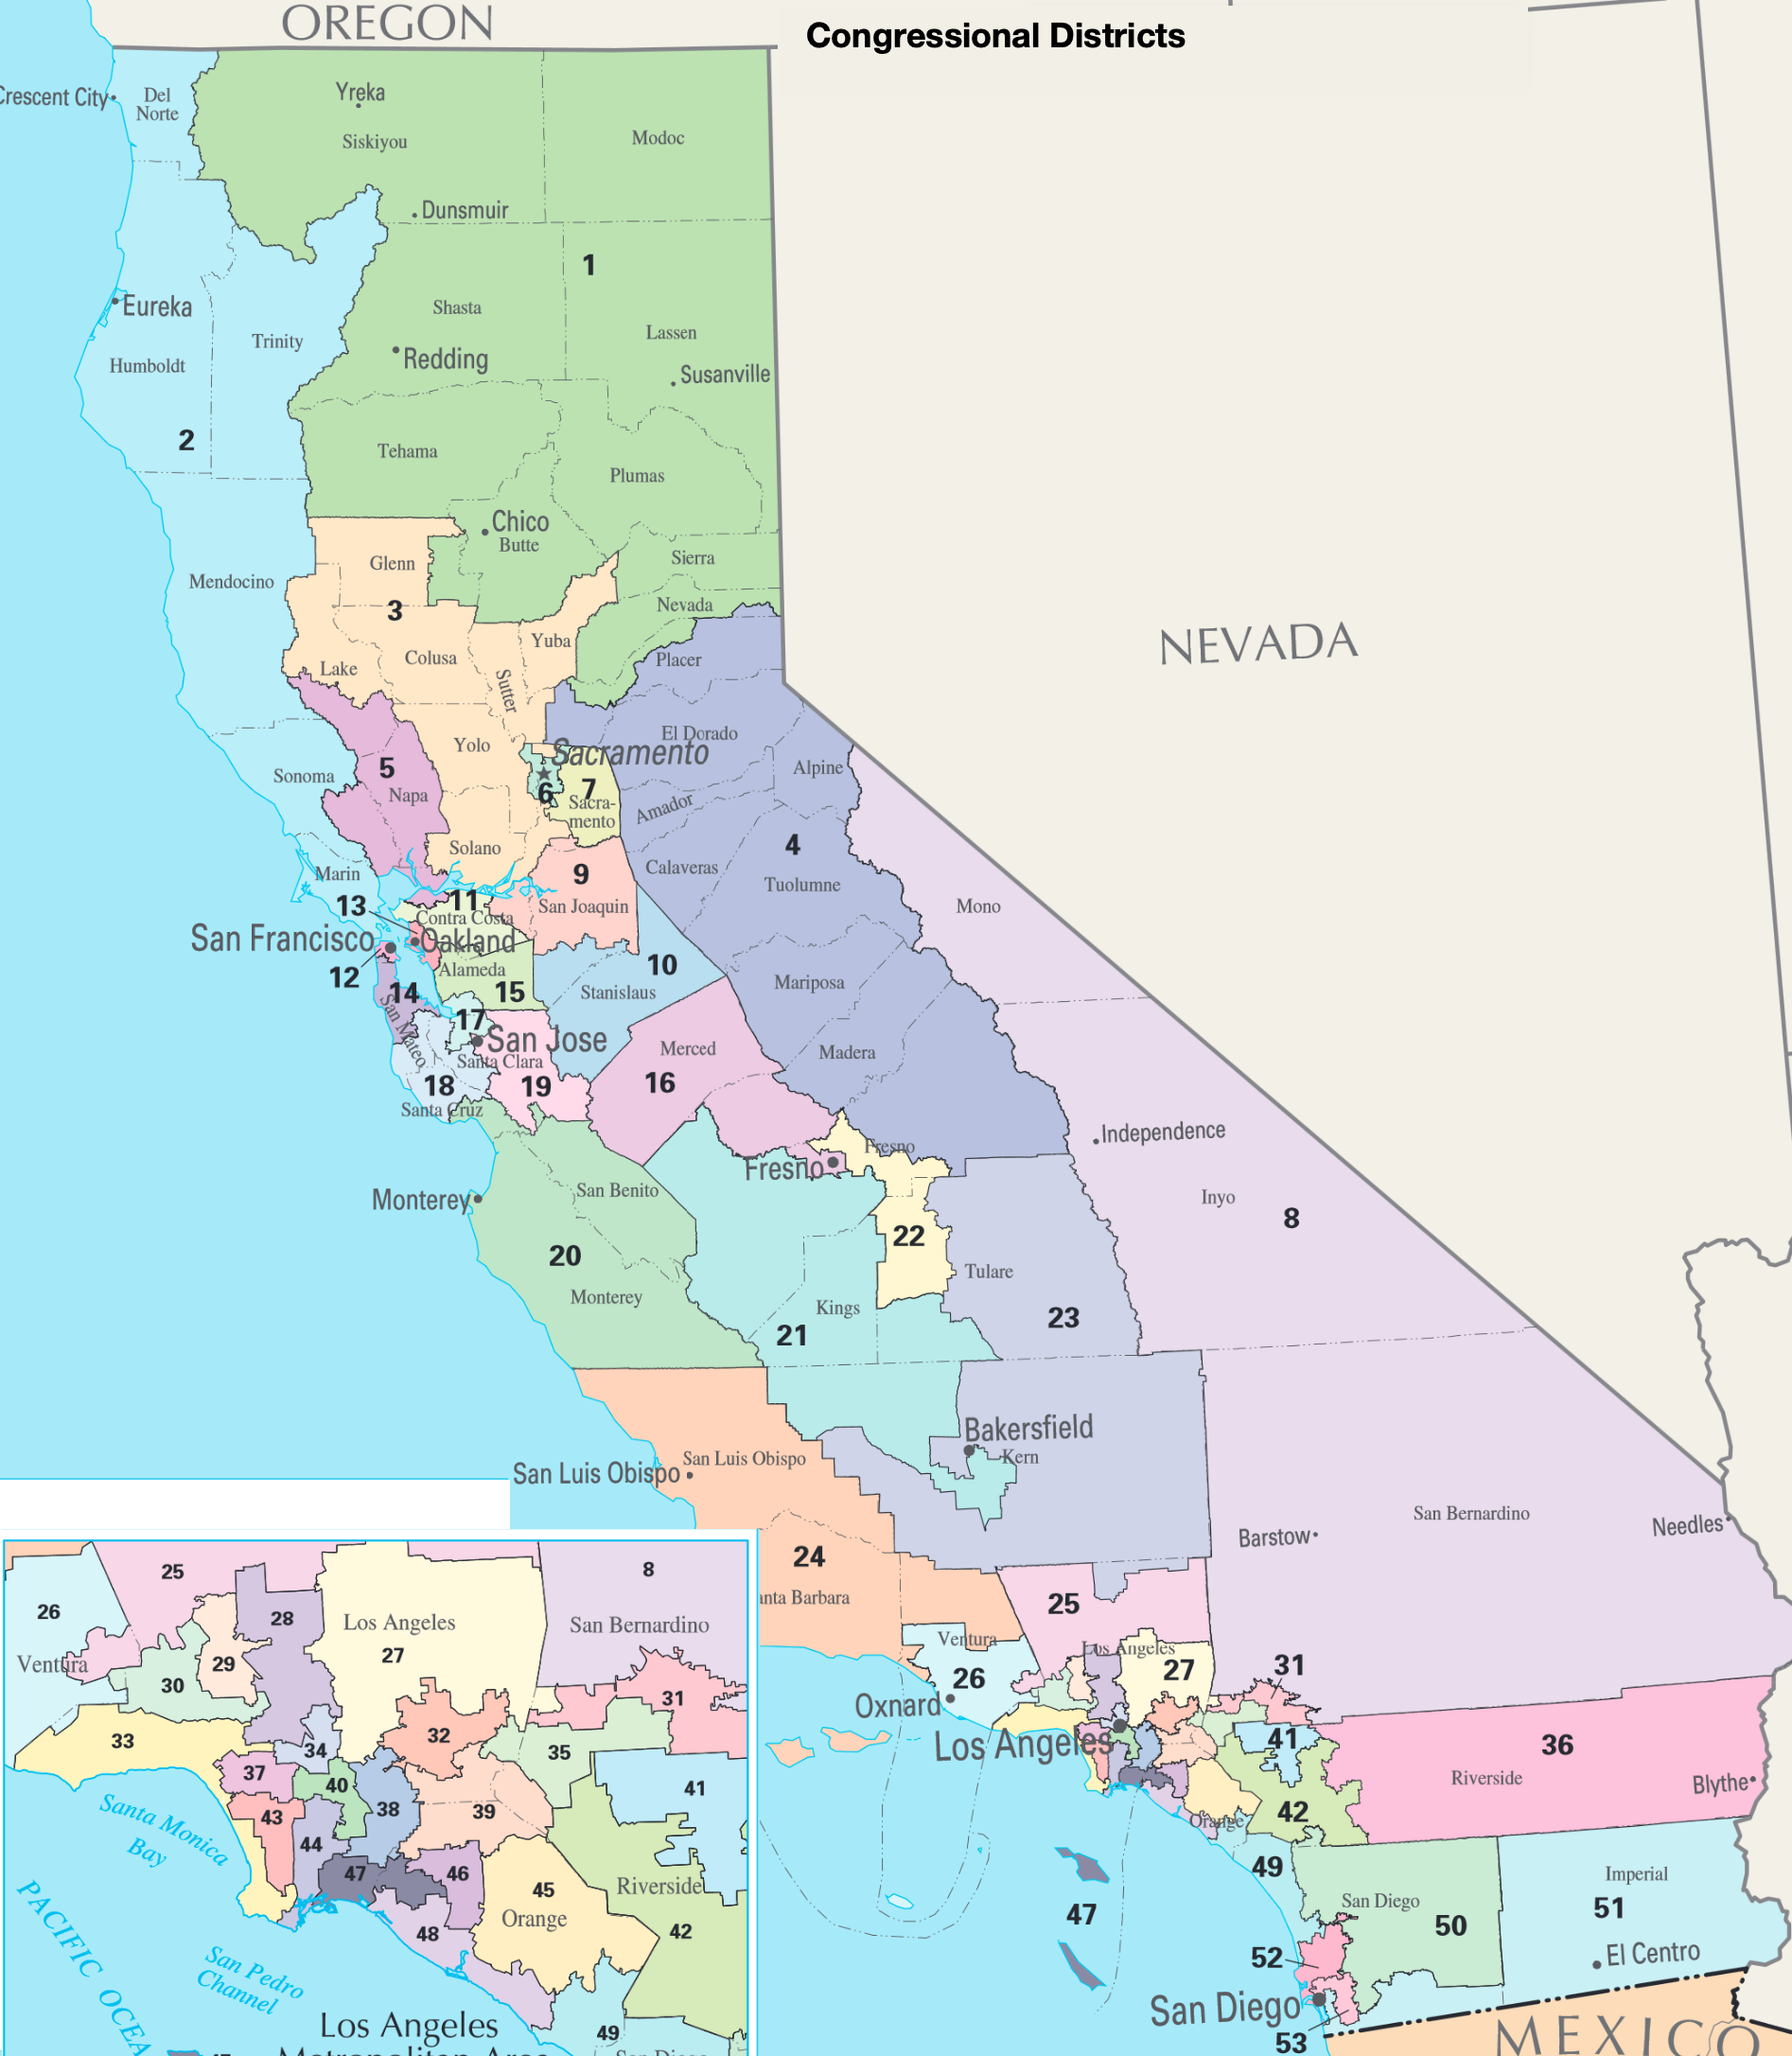
Source: California Congressional Districts | wikipedia
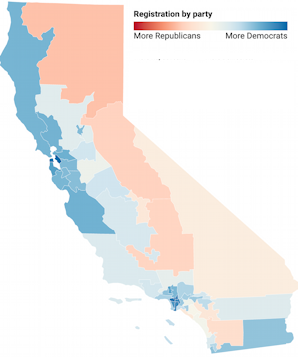
North Central California Counties 2020 registration
In October 2020, California had 22,047,448 registered voters, comprising 87.87% of its total eligible voters.
Sorted by 2020 election results
| Population | Registered voters | Democratic | Republican | D-R spread | Other | No party preference | Biden 2020 | Trump 2020 | election Spread | Election spread vs Registration spread * |
|
|---|---|---|---|---|---|---|---|---|---|---|---|
| California | 39.8 M | 50.5% | 46.1% | 24.2% | +21.9% | 5.7% | 24.0% | 63.5% | 34.3% | 29.2% | 7.3% |
| Bay Area | |||||||||||
| San Francisco | 883,305 | 55.8% | 56.8% | 6.4% | +50.4% | 3.9% | 32.9% | 85.3% | 12.7% | 72.6% | 22.2% |
| Marin | 259,666 | 62.3% | 55.3% | 14.4% | +40.9% | 4.7% | 25.9% | 82.3% | 15.8% | 66.5% | 25.6% |
| Alameda | 1,666,753 | 53.0% | 55.4% | 10.81% | +44.6% | 4.2% | 29.6% | 80.2% | 17.7% | 62.5% | 17.9% |
| San Mateo | 769,545 | 52.6% | 50.0% | 14.8% | +35.2% | 3.9% | 31.3% | 77.9% | 20.2% | 57.7% | 22.5% |
| Sonoma | 499,942 | 55.5% | 51.5% | 17.8% | +33.7% | 5.4% | 25.3% | 74.5% | 23% | 51.5% | 17.8% |
| Santa Clara | 1,937,570 | 46.2% | 45.2% | 16.9% | +28.3% | 3.4% | 34.5% | 72.7% | 25.2% | 47.5% | 19.2% |
| Contra Costa | 1,150,215 | 54.8% | 48.5% | 19.4% | +29.1% | 4.5% | 27.7% | 71.6% | 26.3% | 45.3% | 16.2% |
| Napa | 139,417 | 56.0% | 45.3% | 21.7% | +23.6% | 5.6% | 27.4% | 69.1% | 28.7% | 40.4% | 16.8% |
| Solano | 446,610 | 52.8% | 45.1% | 21.2% | +23.9% | 5.5% | 28.2% | 64% | 33.7% | 30.3% | 6.4% |
| Sacramento Area | |||||||||||
| Yolo | 220,408 | 51.1% | 47.0% | 19.3% | +27.7% | 5.6% | 28.1% | 69.5 | 28.1 | 41.4% | 13.7% |
| Sacramento | 1,540,975 | 50.6% | 42.0% | 25.2% | +16.8% | 5.7% | 27.1% | 61.4% | 36.1% | 25.3% | 8.5% |
| Placer | 393,149 | 60.5% | 27.9% | 41.0% | -13.1% | 6.1% | 25.0% | 45.5% | 52.1% | -6.6% | 6.5% |
| Sierra | 2,987 | 73.1% | 27.3% | 39.9% | -12.6% | 9.8% | 23.0% | 37.8% | 59.2% | -21.4% | -8.8% |
| El Dorado | 190,678 | 63.9% | 28.5% | 39.7% | -11.3% | 7.1% | 24.6% | 44.4% | 53.2% | -8.8% | 2.5% |
| Sutter | 96,807 | 48.3% | 29.3% | 38.7% | -9.4% | 6.6% | 25.4% | 40.7% | 57.2% | -16.5% | -7.1% |
| Other Counties with over 750,000 population | |||||||||||
| Orange | 3,185,968 | 49.9% | 33.3% | 34.0% | -0.7% | 4.2% | 28.5% | ||||
| Kern | 896,764 | 42.3% | 33.1% | 34.9% | -1.7% | 5.5% | 26.5% | ||||
| San_Diego | 3,343,364 | 52.2% | 35.7% | 27.1% | +8.6% | 5.6% | 31.6% | ||||
| Los Angeles | 10,105,518 | 53.4% | 49.7% | 16.7% | +33.0% | 4.8% | 28.8% | ||||
| Riverside | 2,450,758 | 43.2% | 36.8% | 32.1% | +4.7% | 5.4% | 25.7% | ||||
| Fresno | 994,400 | 46.3% | 37.5% | 32.6% | +4.8% | 5.1% | 24.8% | ||||
| San Bernardino | 2,171,603 | 44.3% | 38.8% | 28.8% | +10.0% | 6.0% | 26.4% | ||||
| Ventura | 850,967 | 53.5% | 39.4% | 29.0% | +10.4% | 6.1% | 25.5% | ||||
| San Joaquin | 752,660 | 46.4% | 41.0% | 28.4% | +12.6% | 4.9% | 25.7% | ||||
Statewide:
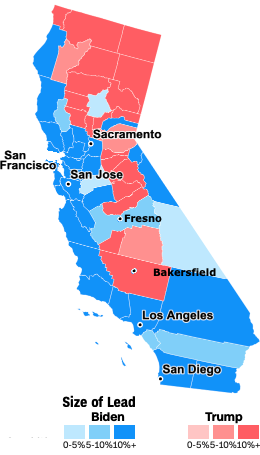
Biden: San Francisco, Marin, Alameda, Santa Cruz, San Mateo and Sonoma had the highest Biden %
Trump: Lassen, Modoc, Tehama, Shasta, Glenn, Amador, Calaveras, Yuba and Sierra had the highest Trump %
Kern county (Bakersfield) had the highest population (917,673) of the Trump counties.
States:
D.C. (92%), Vermont (66.1%) and Massachusetts (65.6%), Maryland (65.4%), and Hawaii (63.7%) had the highest Biden %.
Nebraska Dist. 3 (75%), Wyoming (70%) and West Virginia (69%) had the highest Trump %
Source: 2020 United States presidential election | Wikipedia
Links - Sources:
California Congressional Districts | wikipedia
2020 US Presidential Election Results