 Places
California
Fires
2021 North Central California Fires
Places
California
Fires
2021 North Central California Fires
| Don's Home
Places
California
Fires
2021 North Central California Fires
|
| See also : Caldor Fire | California Fire History | 2022 North Central California Fires | Air Quality |
Contents: North Central CA Fires | Sequoia Fires | Air Quality
California's fire season typically runs from July to December, but September through November are especially deadly.
The containment % towards the end of many fires changes slowly for several weeks as they search for remaining hot spots.
Fires in some Forest Service are not included in CALFires reports.
Other Links:
Cal Fire Incidents near Homewood
Cal Fire Ready for Wildfire
Public Fire Information Websites | US Forest Service
National Fire News | National Interagency Fire Center
California Fire Map: Tracking wildfires near me, across SF Bay Area, Fossil Fire updates | SF Chronicle
See Where Wildfires Are Burning in California - Map | capradio.org
The National Alliance for Public Safety GIS (NAPSG) #FireMappers
CAL Fire Twitter with Red Flag Warnings
Air Quality
Real-time Air Quality Maps | PurpleAir
Air Quality Map | AirNow EPA
About Air quality
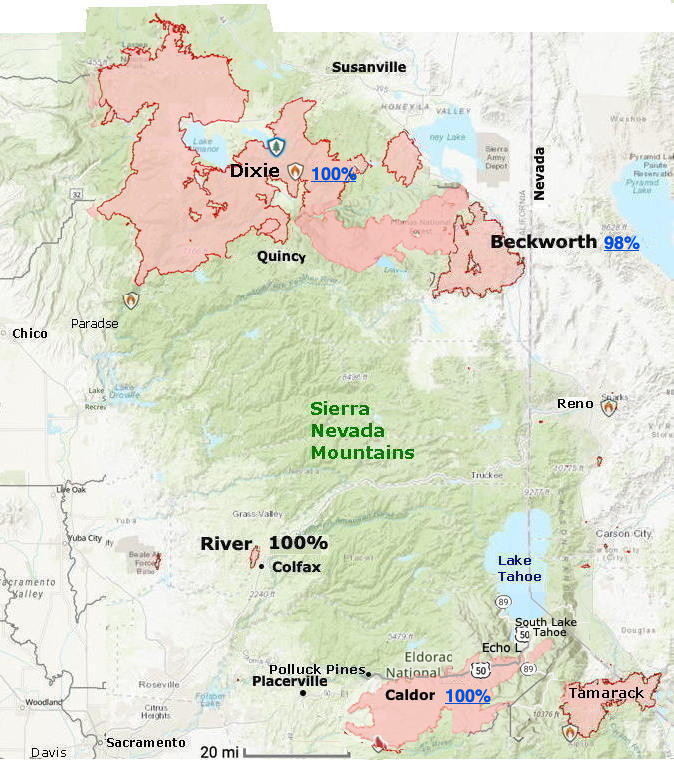
Oct 13 Tamarack 69K acres 100% contained Dixie 963K acres 100% Contained Google Map The Dixie Fire is the largest single fire in California history and the largest currently burning in the U.S.The Bootleg fire in Southern Oregon was 413 acres
It has burned an area larger than the state of Rhode Island.
It is about half the size of the 2020
August Complex Fires, a series of lightning-caused fires across seven counties with a combined 1,032,648 acres that were fought together and that state officials consider California’s largest wildfire overall. Caldor 222 K acres 100% Contained See more on the Caldor Fire. River Fire 3K acres 100% contained Beckworth 105K acres 100% contained
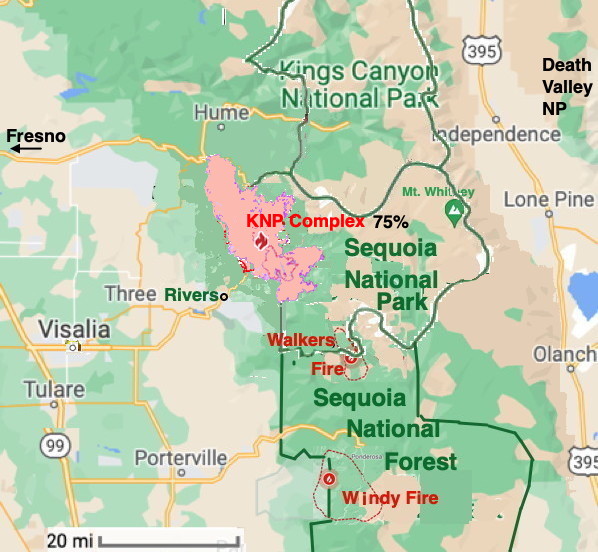
The Castle Fire in 2020 wiped out 10-14% of the world's sequoia population.
Old sequoias can survive even if just 5% of their crowns remain green and unscorched by a fire's heat.
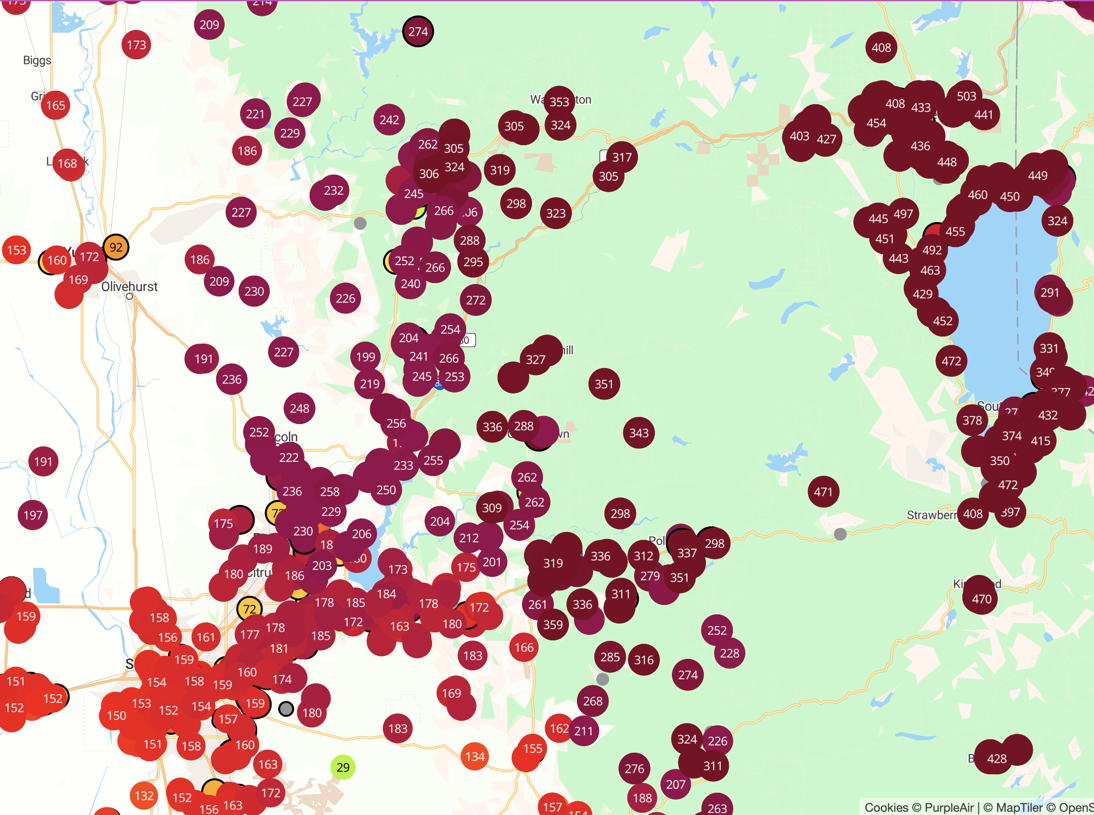
Real-time Air Quality Maps | PurpleAir
Air Quality Map | AirNow EPA
IQAir Tahoe City gives a forecast
AccuWeather Gives a forecast also
Note: Sample results:

Purple Air  140
IQAir        84
EPA
| Air Quality Index Levels of Health Concern | Numerical Value |
EPA | |
|---|---|---|---|
| Good | 0 to 50 | Air quality is satisfactory, and air pollution poses little or no risk. | |
| Moderate | 51 to 100 | Air quality is acceptable; However, there may be a risk for some people, particularly those who are unusually sensitive to air pollution. | |
| Unhealthy for Sensitive Groups | 101 to 150 | Members of sensitive groups may experience health effects. The general public is less likely to be affected. | |
| Unhealthy | 151 to 200 | Some members of the general public may experience health effects; Members of sensitive groups may experience more serious health effects. | |
| Very Unhealthy | 201 to 300 | Health alert: The risk of health effects is increased for everyone. | |
| Hazardous | 301 to 500 | Health warning of emergency conditions: Everyone is more likely to be affected. | |
Note: Values above 500 are considered Beyond the AQI. Follow recommendations for the "Hazardous category." |
|||