Martinsville
Washington Valley Hawkwatch
Martinsville
Washington Valley Hawkwatch
| Home
Martinsville
Washington Valley Hawkwatch
|
|
Annual counts | Distribution (time of day, week) | Daily Mid-September |Changes (last 8 yrs) | Links | Articles | Sources | 2010 totals| 2017 totals
The former Chimney Rock Hawk Watch, founded by Christopher Aquila is now called the Washington Valley Hawkwatch since Chris left in 2017.
Most of the birders who were part of Chris' team are still there counting hawks in September and October on days with favorable weather for migration.
It is located at the eastern side of Washington Valley Park on the first range of the Watchung Mountains. It is accessible via a paved trail from the parking lot at the end of Miller Ln. off of Vosseller Ave. just north of Rt. 22 in Martinsville. On Sunday, Sept. 16 2017 the Somerset County Park Commission had a naturalist and park ranger there to help identify hawks. (tapinto.net article)
Counts are now reported at: In 2017 after 26 years, Christopher Aquila, the founder of the Chimney Rock Hawk Watch, announced he was leaving to help his son, Gavin, establish a New Jersey Avian Migration Project Hawk Watch at Merrill Creek , which is nearer his home. So the name which was associated with Chris was changed.
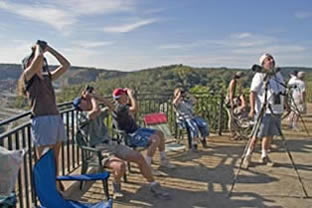
It was one of the more significant sites in North America. Chris was the director of the hawk watch maintained by the Foundation for Avian Research and Education of NJ (FARE of NJ) Avian Migration Project. During it's heyday about 20 birders regularly staff the site from September 1st to November 1st. There are another 10-20 part time helpers. You can learn a lot by just standing around and listening to them call out sightings.
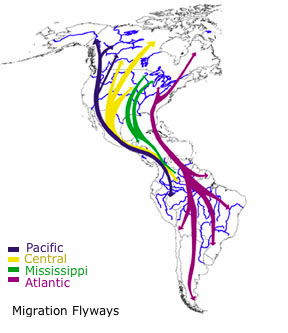
Old pages: Maps: Martinsville, Washington Valley Park These raptors (Hawks, Falcons and Eagles) are migrating from Canada and the Northern U.S. to destinations from Mexico to South America for the winter. See map at HawkMountain.org. Many head south along the coast over Cape May NJ. Others turn west and fly over the Watchung Mountains where favorable wind currents assist them, then turn south when they get to eastern Pennsylvania. See migration below.
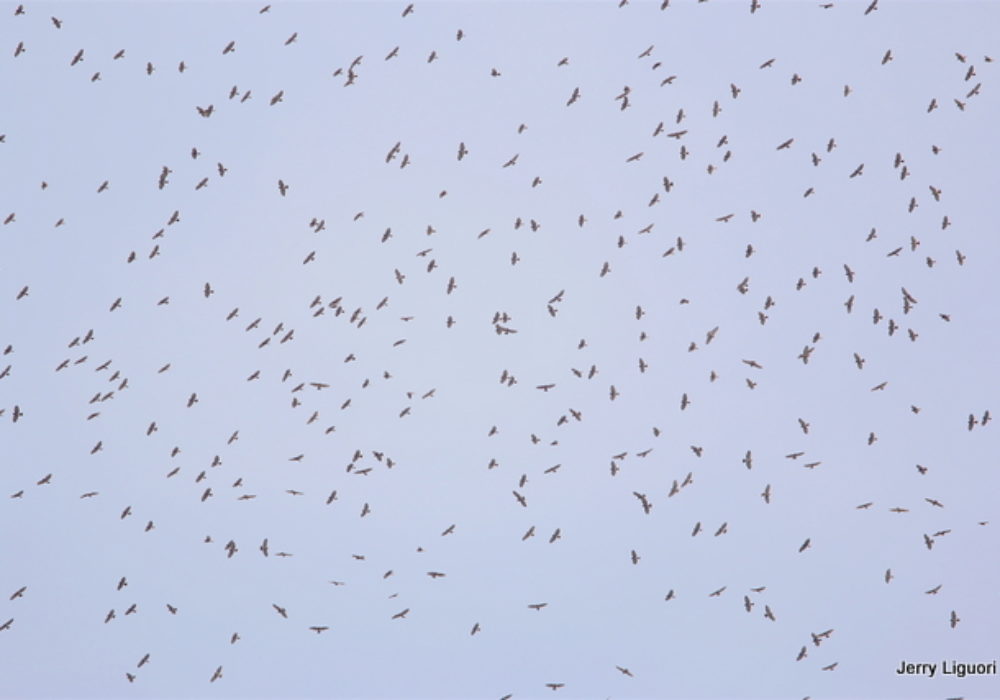
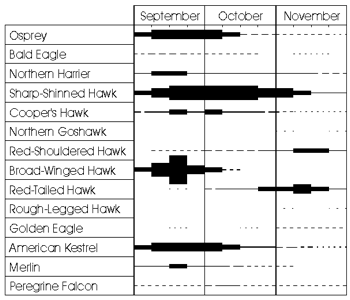
You will usually get 2-3 days between September 13th and 25th, where Large kettles of broad-winged hawks form over Chimney Rock, occasionally with 1,000 or more birds at a time and more than 7,000 in a day.
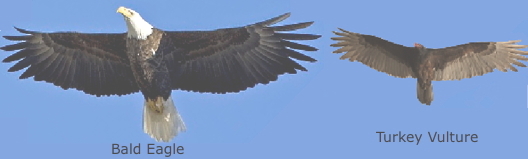
Birds are usually more spread out during the Spring migration which peaks in early May. There is no Spring watch at Washington Valley. There are local groups of turkey vultures which just circle around the area; Novices frequently mistake them for hawks. The vultures are just hanging around, while the hawks and eagles are moving NE to SW.
There are several resident (nesting) red tail hawks, a coopers hawk and several peregrine falcons that over winter here. They do not migrate. You may see them occasionally.
| ||||||||||||||||||||||||||||||||||||||||||||||||||||||||||||||||||||||||||||||||||||||||||||||||||||||||||||||||||||||||||||||||||||||||||||||||||||||||||||||||||||||||||||||||||||||||||||||||||||||||||||||||||||||||||||||||||||||||||||||||||||||||||||||
Cumulative Total Sightings Excluding vultures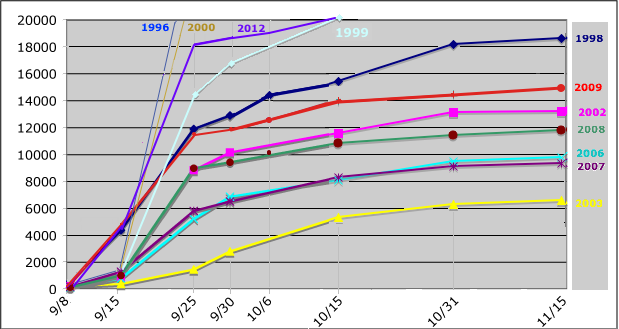 |
| |||||||||||||||||||||||||||||||||||||||||||||||||||||||||||||||||||||||||||||||||||||||||||||||||||||||||||||||||||||||||||||||||||||||||||||||||||||||||||||||||||||||||||||||||||||||||||||||||||||||||||||||||||||||||||||||||||||||||||||||||||||||||||||
|
Counts for the 3rd week in September Most of the variability comes from Sept 14-25 which usually accounts for 40-70% of the total.
Sightings on any given day will vary considerably (from only a few to 4,000 or more) depending on wind direction. See wind below. Note: There was speculation that because 2015 had the longest drought in Aug-Sep since 1996 there would be a big flight in this period, however it appears most of the broad-winged hawks went west of Chimney Rock.
Sept 22 was the bigest day in 2017 with 528 birds including 341 broad-wings.
The second highest day was Sept 10 in 1998 and Sept. 9 2017. | ||||||||||||||||||||||||||||||||||||||||||||||||||||||||||||||||||||||||||||||||||||||||||||||||||||||||||||||||||||||||||||||||||||||||||||||||||||||||||||||||||||||||||||||||||||||||||||||||||||||||||||||||||||||||||||||||||||||||||||||||||||||||||||||
* In 2003 there were 1,487 broad-winged hawks between Sept. 30 and Oct. 3.
| Note: Broad-winged hawks do not not like to fly over water so head west across ridges accounting for the large numbers here, (60-80% of the total). Broad-winged hawks are only 3% of the total in Cape May. Depending on wind patterns they may turn off north of Chimney Rock resulting in low broad-wined counts and low total counts. | |||||||||||||||||||||||||||||||||||||||||||||||||||||||||||||||||||||||||||||||||||||||||||||||||||||||||||||||||||||||||||||||||||||||||||||||||||||||||||||||||||||||||||||||||||||||||||||||||||||||||||||||||||||||||||||||||||||||||||||||||||||||||||||
|
§ Count stoped on Nov. 15 in recent years 1. Less vultures 2. Counts were spotty in 2017. They didn't start until Sept. 10. There were counts on the days with favorable weather.
| ||||||||||||||||||||||||||||||||||||||||||||||||||||||||||||||||||||||||||||||||||||||||||||||||||||||||||||||||||||||||||||||||||||||||||||||||||||||||||||||||||||||||||||||||||||||||||||||||||||||||||||||||||||||||||||||||||||||||||||||||||||||||||||||
|
Average hawks per day (2009-2013) |
Distribution by time of day  (For a day with 100 sightings) 5 Year average sightings per day (1997-2001)
weather. see below. |
One day count distribuition for Sep. 15-30 (Av. 1997-2001)
| ||||||||||||||||||||||||||||||||||||||||||||||||||||||||||||||||||||||
|
Wind:
The stronger the wind, the closer the hawks will fly to the treetops where substantially less air turbulence occurs, and the more easily the hawks will be seen.
|
Counts by Wind Direction (Birds/Hr.)
| |||||||||||||||||||||||||||||||||||||||||||||||||||||||||||||||||||||||
|
Note: The table to the right above was created from data in early 2000 and shows higher counts with an east wind, however current common knowledge is that a NW wind is best.
Counts by Species: (thru 2005) (see changes below)
|
| Species | Cape May * | |||||||
|---|---|---|---|---|---|---|---|---|
| 1996-2000 | 2004-2008 | Decline/ Increase | % of total (2004-8) | Decline/ Increase |
||||
| Average # | % of total | Average # | % of total | |||||
| Broad-winged | 15,688 | 65.6% | 5,980 | 53.5% | -62% | 3% | -54% | |
| Sharp-shinned | 3,876 | 16.2% | 2,458 | 22.0% | -37% | 45% | -47% | |
| Am. Kestrel | 1,724 | 7.2% | 779 | 7.0% | -55% | 13% | -48% | |
| Osprey | 733 | 3.1% | 468 | 4.2% | -36% | 6% | -49% | |
| Cooper's | 475 | 2.0% | 467 | 4.2% | -2% | 15% | 32% | |
| N. Harrier | 278 | 1.2% | 213 | 1.9% | -23% | 3% | -40% | |
| Merlin | 276 | 1.2% | 197 | 1.8% | -29% | 5% | -25% | |
| Red-shouldered | 242 | 1.0% | 184 | 1.6% | -24% | 1% | 4% | |
| Red-tailed | 271 | 1.1% | 155 | 1.4% | -43% | 5% | -48% | |
| Bald Eagle | 90 | 0.4% | 129 | 1.2% | 44% | 0.8% | 46% | |
| Peregrine Falcon | 77 | 0.3% | 98 | 0.9% | 27% | 4% | 0% | |
| Golden Eagle | 11 | 0.05% | 14 | 0.13% | 31% | 0.05% | -19% | |
| N. Goshawk | 7.0 | 0.03% | 2.4 | 0.02% | -66% | 0.1% | -48% | |
| Rough-legged | 1.2 | 0.01% | 0.6 | 0.01% | -50% | 0.002% | -82% | |
| Unidentified | ||||||||
| Raptor | 86 | 0.4% | 16 | 0.1% | -82% | |||
| Acciptor | 42 | 0.2% | 11 | 0.1% | -75% | |||
| Buteo | 19 | 0.1% | 5 | 0.0% | -72% | |||
| Falcon | 12 | 0.1% | 5 | 0.0% | -58% | |||
| Total | 23,909 | 11,182 | -53% | 33,511 | -39% | |||
The declines vary by species.
Broad-winged hawks, Sharp-shinned hawks, American Kestrels, Osprey and Red-tailed hawks had the largest declines of 44-60%.
Cooper's hawks increased.
Bald eagles have increased by about 45% as they continue to recover from their decline due to DDT (1946-1972), loss of habitat and hunting.
Osprey's are frequently hunted in Mexico.
Most others declined in the 25-25% range.
There are a variety of factors which more experienced birders have proposed to account for the decline. I couldn't find any definitive studies.
Demography and Populations -- Sharp-shinned Hawk -- Birds of North America Online at Cornell says:. (Requires subscription: $5/mo, $42/yr)
"Sharp-shinned hawks are the most difficult accipiter and among the most difficult birds to census in North America."
"Declines in counts at migration watchsites in e. North America from 1940s to early 1970s almost certainly due to widespread use of DDT."
"Declines in the 1980s and early 1990s initially were attributed to various factors acting singly or in concert: environmental contaminants (mainly organochlorines), migratory short-stopping, natural population cycles, depressed populations of Neotropical migratory prey species, and the aging of eastern forests. Recent analyses of concurrent Christmas Bird Count data from the region, however, have revealed significant increases in numbers of Sharp-shinned Hawks overwintering in areas north of the watchsites in question (i.e., e. Canada and the ne. U.S.), strongly suggesting that the declines are due to migratory short-stopping�perhaps the result of increased use of bird feeders as hunting habitat by sharp-shins�and not to an overall decline in eastern populations (Dunn and Tessaglia 1994, Duncan 1996, Viverette et al. 1996)."
Viverette, C. B., S. Struve, L. J. Goodrich, and K. L. Bildstein. 1996. Decreases in migrating Sharp-shinned Hawks at traditional raptor-migration watchsites in eastern North America. The Auk 113:32-40.
Conservation Status Report - Sharp-shinned Hawk, 2007 at HawkMountain.org states:
"From 1974 to 2004, migration counts declined a statistically
significant 1.1 % per year at Hawk Mountain Sanctuary, Pennsylvania and 4.5
% per year at Cape May Bird Observatory, New Jersey."
"The decline in
numbers at Cape May might indicate declined reproductive success, as most individuals
counted at Cape May Point are juveniles."
"The discrepancy between migration
trends (lower) and those from CBCs (Christmas Bird Counts) (higher) may be due to migratory short-stopping."
Fall Raptor Migration over Lake Erie Metro Park (increasing)
State of the Birds - The 2009 Report from the Interior Dept. shows that Wetland birds are increasing while Grasland and Aridland birds are declining.
Saving Migratory Birds for Future Generations: The Success of the Neotropical Migratory Bird Conservation Act, Compiled by American Bird Conservancy, May 2009
A Feb. 2009 Audubon Society study found that more than half of 305 birds species in North America, a hodgepodge that includes robins, gulls, chickadees and owls, are spending the winter about 35 miles farther north than they did 40 years ago.
Over the 40 years covered by the study, the average January temperature in the United States climbed by about 5 degrees Fahrenheit, which they speculate may be the reason. (Hawks were not mentioned in the summary I saw.)
Potential Impacts of Global Climate Change on Bird Communities of the Southwest by Charles van Riper III, Mark K. Sogge, and David W. Willey Biological Resources Division U.S. Geological Survey
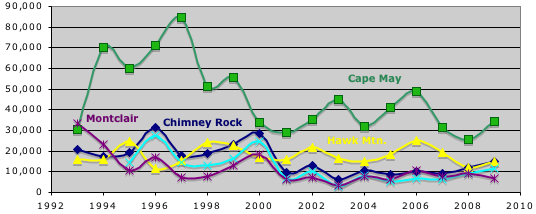
Species mix Chimney Rock vs Cape May:
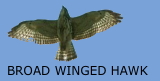
Buteos (Broad-Winged hawks in particular) like to exploit updrafts off of ridges, hence the large numbers at Chimney Rock on the first range of the Watchung Mountains.
Falcons (Peregrine, Kestrel, Merlin) rely more on their own powers of flight and do not need mountain updrafts.
Accipiters (Sharp-shinned, Coopers Hawks, ...) and falcons tend to follow the shorelines, hence higher counts at Cape May.
Other Hawk Watch Sites:
Counts are for Fall only.
| Site | Location | Median Fall Totals | 2002 Total |
|---|---|---|---|
| Cape May | Cape May, NJ | 50,000 | 35,267 |
| Hawk Mountain | Kempton, PA | 20,000 | 21,708 |
| Chimney Rock | Martinsville, NJ | 19,000 | 13,241 |
| Montclair | Montclair, NJ | 12,000 | 11,340 |
| Militia Hill | Fort Washington State Park, PA | 9,000 | |
| Wildcat Ridge | Hibernia, NJ | 9,000 | 7,011 |
| Racoon Ridge | Blairstown (Hemlock Glen), NJ | 15,000 | * 4,238 |
| Scotts Mountain, Merrill Creek | Washington, NJ | 9,000 | 8,737 |
| Sunrise Mountain | Stokes State Forest, Branchville, NJ | * 4,678 | |
| Bake Oven Knob | Germansville, PA | 20,778 |
Scherman-Hoffman Wildlife Sanctuary (New Jersey Audubon Society)
Bernardsville, (908) 766-5787
Migration:
 TyBroad Broad-winged hawks migration:
Hawks will fly around 10 hours per day and travel from 100 to 250 miles.
Ducks and geese might travel as much as 400 to 500 miles per day.
Many species of wading and swimming birds are able to feed at all hours, they migrate either by day or night. Soaring birds such as broad-winged hawks only migrate during the day to take advantage of thermals.
In some species of raptors, every individual migrates. In other species, only part of the population migrates and some individuals remain on the breeding grounds. Other species are completely sedentary. Overall, about 45 percent of all raptor populations migrate.
Raptors fly from 29-40 MPH at an elevation of 700 - 4,000 ft.
Migration may have as much to do with availability of food as weather.
See also Migration Path | Hawk Mountain Sanctuary
Wintering locations:
| Broad-wings | Central America and N. South America |
| Sharp-shinned | Southern US, Central America |
| Coopers | Gulf coast, Mexico to Honduras |
| Kestrel | Coastal Mexico, Central America |
| Ospreys, Peregrine falcons | Pacific coast of S. America & Bolivia |
Terms:
BBS - Breeding Bird Survey
CBC - Christmas Bird Count
Articles
- John Kee - Species Records thru 2005
- Christopher D. Aquila & Steven B. Byland - A Five Year Analysis of Autumn Hawk Migration at Chimney Rock, Martinsville, N.J. (1990-1994)
- Kyle McCarty and Keith L. Bildstein - "Using Autumn Hawk Watch to Track Raptor Migration and to Monitor Populations of North American Birds of Prey", USDA Forest Service Gen. Tech. Rep. PSW-GTR-191. 2005
- Robyn Worcester, Ron Ydenberg - Cross-Continental Patterns In The Timing Of Southward
Peregrine Falcon Migration In North America, 2008,
- Johnd Elong, Stephen W. Hoffman - Differential Autumn Migration Of Sharp-Shinned And
Cooper's Hawks In Western North America
Links
Other Links:
Current Counts at Hawk Migration Assiciation of North America's (HMANA) hawkcount.org (NJWMP at Chimney Rock)
Bird Watching Here
Cornell Lab of Ornithology
Cornell's All About Birds
The Hawk Conservancy Trust
Data entry overload? Learn eBird tricks and tips! - eBird.org
Binoculars,
Birding and Raptors in Northwest New Jersey at www.njskylands.com
Bird Watching in hobbies
Squirl Proof Bird feeders
Autumn Raptor Migration
NPWRC :: Migration of Birds
Sources:
chimneyrock.s5.com John Kee.
www.crhw.org, chimneyrock.s5.com
2017 counts:
8, 9, 10, 11, 12, 15, 16, 17, 20, 21, 22,
8/21, 9/22,
See also:
Washington Valley Park Hawk Watch | SomersetCountyParks.org
Chimney Rock Quarry
25 Nature Spectacles in New Jersey, by Joanna Burger and Michael Gochfeld
Hawk Watch | Somerset Co. Park Comission