Under Construction 
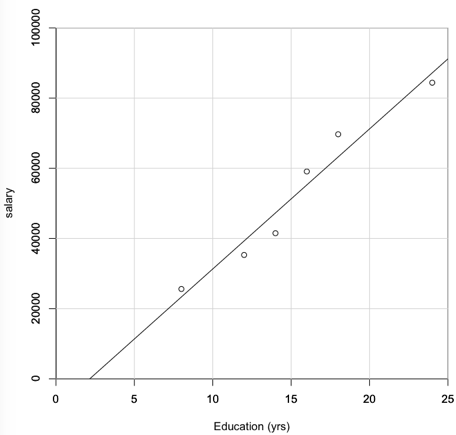
R is a language and environment for statistical computing and graphics. It is a GNU project which is similar to the S language and environment which was developed at Bell Laboratories R is the 6th most common programming language according to IEEE. R provides a wide variety of statistical (linear and nonlinear modelling, classical statistical tests, time-series analysis, classification, clustering, ...). CRAN - Comprehensive R Archive Network - Has packages to extend R. Rstudio is an integrated development environment (IDE) for R. It includes a console, syntax-highlighting editor, as well as tools for plotting, history, debugging and workspace management. I used S briefly while at the Labs and unfortunately R still has the UNIXy obtuse command structure that gives it a steep learning curve. Example: Read a csv (Comma separated values) file, plot and compute correlation. sal-edu.csv contains Edu,Sal 8,25600 12,35300 14,41500 16,59100 18,69700 24,84400 > test <- read.csv(file="/Users/donmcbride/Programs/sal-edu.csv",head=TRUE,sep=",") > education <- test$Edu > salary <- test$Sal > opt <- options("scipen" = 10) # Don't use scientific notation * > plot (education, salary, xlim=c(0, 25), ylim=c(0, 100000), xlab="Education (yrs)", yaxs="i", xaxs="i") > # xaxs="i" causes x 0 point to line up with y axis > axis(1, tck=1, col.ticks="light gray") #adds grid lines > axis(2, tck=1, col.ticks="light gray") > abline(lm(salary ~ education)) # Plot linear regression lineSome quirks: * scipen = 10 - Use fixed notation "60,000" unless it is more than 10 digits then use scientific notation "6 e4". It defaults to 4 or 5. opt <- options("scipen" = 10)
By default ranges are enlarged by
6%, so that the specified values do not lie at the very edges of the plot region. To get 0 to line up with the axis, you need to set the style of the axis interval calculation with xaxs and yaxs. xaxs="i" sets it to "interval" so 0 lines up. When I put a "$" on the salary amounts it messed up the plot. Apparently it thinks it's an alphanumeric field. I haven't figured out how to fix this. For those from a C background, R provides a wrapper for the sprintf C-library function. e.g. sprintf("$%.2f", 99.999)
Links:
Help sights:
Charts - Plots
Enhancements-Libraries:
Other:
|