By decade:
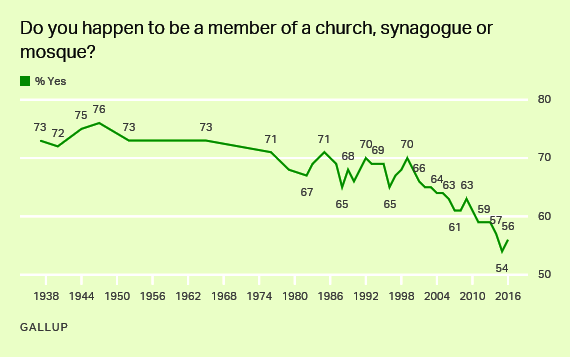
Five Key Findings on Religion in the U.S. Gallup
By age:
The number who attend services at least weekly or nearly every week in 2010:
Generation         Born            Age     Attendance
Millenials 1981-2000  18-29  18-27%
Gen X      1965-1990  30-45  27-33%
Boomer     1946-1964  46-64  32-38%
Silent     1928-1945  65-82  44-48%
Greatest   before 1928   83+ 56-60%
Note these numbers vary depending on which report you look at.
By Religion
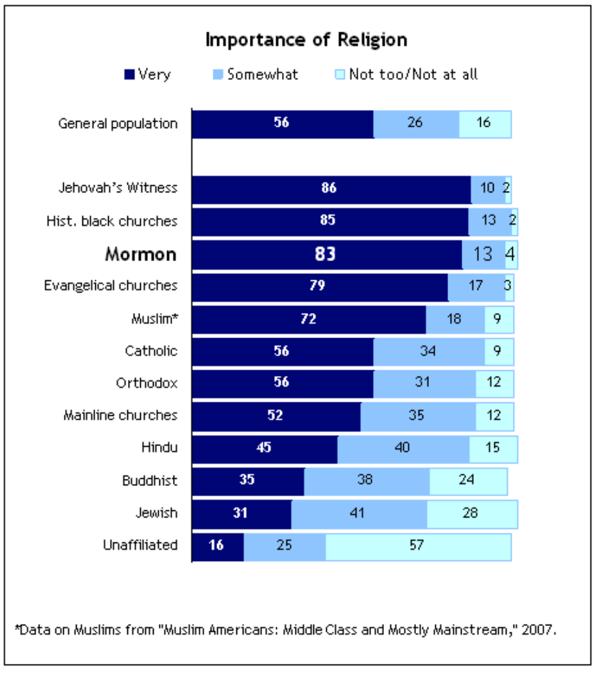
Religious Beliefs and Practices | Pew Research Center

 All men          32%
 All women        44
 Catholic men     26
 Catholic women   49
 Protestant men   42
 Protestant women 50
By State:
Percentage of Christians who attend church at least once a week, 2014
| Rank | State | Atten- dance | 2016 Election |
|---|---|---|---|
| 1 | Utah | 70% | R |
| 2 | Tennessee | 59% | R |
| 3 | South Carolina | 57% | R |
| 4 | Virginia | 57% | D |
| 5 | Alabama | 55% | R |
| 6 | Mississippi | 54% | R |
| 7 | West Virginia | 54% | R |
| 8 | Louisiana | 53% | R |
| 9 | Oklahoma | 53% | R |
| 10 | Wyoming | 52% | R |
| 11 | Georgia | 51% | R |
| 12 | Nebraska | 51% | R |
| 13 | Texas | 51% | R |
| 14 | Arkansas | 50% | R |
| 15 | Kentucky | 50% | R |
| 16 | North Carolina | 50% | R |
| 17 | Idaho | 49% | R |
| 18 | Indiana | 49% | R |
| 19 | Ohio | 49% | R |
| 20 | Arizona | 48% | R |
| 21 | Iowa | 47% | R |
| 22 | Kansas | 47% | R |
| 23 | Missouri | 47% | R |
| 24 | Florida | 46% | R |
| 25 | Montana | 46% | R |
| 26 | Rhode Island | 46% | D |
| 27 | California | 45% | D |
| 28 | Delaware | 45% | D |
| 29 | Michigan | 45% | R |
| 30 | Nevada | 45% | D |
| 31 | Washington | 45% | D |
| 32 | Illinois | 44% | D |
| 33 | New Mexico | 44% | D |
| 34 | Oregon | 44% | D |
| 35 | Pennsylvania | 44% | R |
| 36 | South Dakota | 44% | R |
| 37 | Alaska | 43% | R |
| 38 | Minnesota | 43% | D |
| 39 | Colorado | 43% | D |
| 40 | New York | 43% | D |
| 41 | Maryland | 42% | D |
| 42 | New Jersey | 42% | D |
| 43 | North Dakota | 41% | R |
| 44 | Hawaii | 40% | D |
| 45 | Washington, D.C. | 39% | D |
| 46 | Wisconsin | 38% | R |
| 47 | Connecticut | 36% | D |
| 48 | Massachusetts | 34% | D |
| 49 | New Hampshire | 34% | D |
| 50 | Vermont | 34% | D |
| 51 | Maine | 31% | D |
| Nigeria | 87% |
| Zambia | 85% |
| Chad | 83% |
| Ghana | 82% |
| Liberia | 82% |
| Tanzania | 82% |
| Mozambique | 81% |
| Uganda | 81% |
| Kenya | 80% |
| Guatemala | 78% |
| Ethiopia | 75% |
| Rwanda | 75% |
| Democratic-Republic-of-the-Congo | 72% |
| Cameroon | 70% |
| Honduras | 70% |
| El Salvador | 68% |
| Guinea-Bissau | 66% |
| Botswana | 62% |
| South-Africa | 62% |
| Nicaragua | 58% |
| Philippines | 58% |
| Malta | 57% |
| Dominican-Republic | 56% |
| Bolivia | 55% |
| Costa Rica | 55% |
| Colombia | 52% |
| Republic-of-Ireland | 51% |
| Panama | 51% |
| Morocco | 50% |
| Brazil | 49% |
| Poland | 48% |
| Mexico | 47% |
| United-States | 47% |
| Ecuador | 39% |
| Israel | 38% |
| Italy | 37% |
| Lebanon | 37% |
| Peru | 35% |
| Paraguay | 33% |
| Canada | 29% |
| Greece | 27% |
| Slovakia | 26% |
| Venezuela | 26% |
| Australia | 25% |
| Argentina | 22% |
| Chile | 22% |
| United-Kingdom | 20% |
| Spain | 19% |
| Uruguay | 16% |
| Germany | 13% |
| Ukraine | 13% |
| Lithuania | 12% |
| Belgium | 11% |
| France | 11% |
| Russia | 8% |
