 Reference
Demographics
World Economics
Reference
Demographics
World Economics
| Home
Reference
Demographics
World Economics
| |
G8 - The G7 (Group of Seven) countries are Canada, France, Germany, Italy, Japan, the United Kingdom, and the United States. The European Union is also a member but is considered a "non-enumerated" member.
It was G8 before Russia was eliminated
OECD - Organization for Economic Co-operation and Development
38 Countries:
Australia, Austria, Belgium, Canada, Chile, Colombia, Costa Rica, Czechia, Denmark, Estonia, Finland, France, Germany, Greece, Hungary, Iceland, Ireland, Israel, Italy, Japan, Korea, Latvia, Lithuania, Luxembourg, Mexico, Netherlands, New Zealand, Norway, Poland, Portugal, Slovak Republic, Slovenia, Spain, Sweden, Switzerland, Turkey, United Kingdom, United States,
The G20, or Group of Twenty, is an intergovernmental forum for major economies that discusses international economic cooperation and financial stability.
19 member countries and two regional blocs: the European Union and the African Union.
Argentina, Australia, Brazil, Canada, China, France, Germany, India, Indonesia, Italy, Japan, Mexico, Russia, Saudi Arabia, South Africa, South Korea, Turkey, the United Kingdom, and the United States.
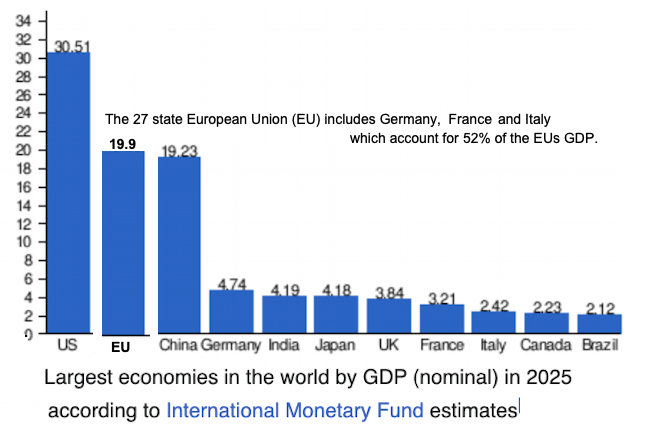
Top 50 from International Monetary Fund (IMF):
The top 50 account for 93% of total GDP of $
117,165,394
| Country | GDP [1] | Real GDP per capita [2] |
|
|---|---|---|---|
| 1 | United States | $30,615,743 | $75,500 |
| 2 | China | $19,398,577 | $23,800 |
| 3 | Germany | $5,013,574 | $62,800 |
| 4 | Japan | $4,279,828 | $46,100 |
| 5 | India | $4,125,213 | $9,800 |
| 6 | United Kingdom | $3,958,780 | $52,500 |
| 7 | France | $3,361,557 | $54,500 |
| 8 | Italy | $2,543,677 | $53,100 |
| 9 | Russia | $2,540,656 | $41,700 |
| 10 | Canada | $2,283,599 | $56,700 |
| 11 | Brazil | $2,256,910 | $19,600 |
| 12 | Spain | $1,891,371 | $48,400 |
| 13 | Mexico | $1,862,740 | $22,000 |
| 14 | South Korea | $1,858,572 | $50,400 |
| 15 | Australia | $1,829,508 | $60,100 |
| 16 | Turkey | $1,565,471 | $35,300 |
| 17 | Indonesia | $1,443,256 | $14,500 |
| 18 | Netherlands | $1,320,635 | $70,900 |
| 19 | Saudi Arabia | $1,268,535 | $62,700 |
| 20 | Poland | $1,039,619 | $45,100 |
| 21 | Switzerland | $1,002,666 | $82,000 |
| Taiwan[3] | $884,387 | $32,300 | |
| 22 | Belgium | $716,980 | $63,100 |
| 23 | Ireland | $708,771 | $115,300 |
| 24 | Argentina | $683,371 | $26,500 |
| 25 | Sweden | $662,318 | $63,300 |
| 26 | Israel | $583,361 | $47,300 |
| 27 | Singapore | $564,774 | $132,600 |
| 28 | United Arab Emirates | $548,598 | $68,600 |
| 29 | Thailand | $546,224 | $21,700 |
| 30 | Austria | $534,301 | $63,300 |
| 31 | Norway | $504,276 | $91,100 |
| 32 | Philippines | $497,495 | $10,400 |
| 33 | Vietnam | $490,970 | $14,400 |
| 34 | Bangladesh | $467,218 | $8,500 |
| 35 | Denmark | $449,940 | $73,700 |
| 36 | Malaysia | $444,984 | $34,100 |
| 37 | Colombia | $427,766 | $18,500 |
| Hong Kong[4] | $423,999 | $66,200 | |
| 38 | South Africa | $410,338 | $13,600 |
| 39 | Romania | $403,395 | $40,600 |
| 40 | Pakistan | $373,100 | $5,500 |
| 41 | Czech Republic (Czechia) | $360,244 | $48,000 |
| 42 | Egypt | $347,342 | $16,800 |
| 43 | Chile | $343,823 | $30,200 |
| 44 | Iran | $341,013 | $16,200 |
| 45 | Portugal | $321,440 | $41,900 |
| 46 | Finland | $303,945 | $55,600 |
| 47 | Peru | $303,293 | $15,700 |
| 48 | Kazakhstan | $300,538 | $35,900 |
| 49 | Algeria | $268,885 | $15,400 |
| 50 | Greece | $257,100 | $37,800 |
2. GDP per capita is often used as a proxy indicator of a country's standard of living; however, this is inaccurate because GDP per capita is not a measure of personal income and does not take into account social and environmental costs and benefits.
Real GDP per capita based on purchasing power parity (PPP) which is value of all final goods and services produced within an economy in a given year. This is similar to nominal GDP per capita but adjusted for the cost of living in each country.
It is used in the CIA World Factbook
3. Taiwan - The name used in the IMF report is "Taiwan Province of China",
The IMF's official recognition of the People's Republic of China (PRC) as the legitimate representative of China has led to this designation.
however it is not included in China's GDP.
Smaller Countries with  Real GDP per capita > 30K

Median GDP per capita for all countries is $18K
	Monaco	$270,100
2	Liechtenstein	$210,600
3	Singapore	$132,600
4	Luxembourg	$128,200
15	Greenland	$71,000
16	San Marino	$70,900
18	Falkland Islands 	$70,800
19	Faroe Islands	$70,400
20	Guyana	$70,300
23	Andorra	$65,900
24	Iceland	$65,600
11	Brunei	$79,200
12	Cayman Islands	$78,100
13	San Marino	$70,900
30	Malta	$60,500
32	Bahrain	$59,100
40	Slovenia	$48,500
45	Lithuania	$47,200
46	Virgin Islands	$46,500
48	Sint Maarten	$45,800
49	Kuwait	$45,400
50	Poland	445,100
51	Puerto Rico	$44,100
56	Hungary	$40,700
57	Romania	$40,600
58	British Virgin Islands	$40,500
59	Aruba	$40,500
60	Slovakia	$40,300
61	Latvia	$38,900
64	Panama	$36,400
65	Bahamas, The	$36,200
55	Estonia	$41,500
70	Bulgaria	$34,100
71	Malaysia	$34,100
Turks and Caicos Islands	$33,400
74	Uruguay	$32,000
75	Trinidad and Tobago	$31,700
76	Saint Kitts and Nevis	$31,300
77	Anguilla	$31,000
78	Chile	$30,200
82	Belarus	$29,000
86	costa Rica $27,000
88	Argentina	$26,500
| Rank | Country | Exports | Imports | Total | Trade Balance | Ratio of imports to exports |
|---|---|---|---|---|---|---|
| EU | 370.2 | 605.8 | 975.9 | -235.6 | 0.61 | |
| 1 | Mexico | 334 | 505.9 | 839.9 | -171.9 | 0.66 |
| 2 | Canada | 349.4 | 412.7 | 762.1 | -63.33 | 0.85 |
| 3 | China | 143.5 | 438.9 | 582.4 | -295.4 | 0.33 |
| 4 | Germany | 75.6 | 160.4 | 236 | -84.8 | 0.47 |
| 5 | Japan | 79.7 | 148.2 | 227.9 | -68.5 | 0.54 |
| 6 | South Korea | 65.5 | 131.5 | 197.1 | -66 | 0.50 |
| 7 | Taiwan | 42.3 | 116.3 | 158.6 | -73.9 | 0.36 |
| 8 | Vietnam | 13.1 | 136.6 | 149.7 | -123.5 | 0.10 |
| 9 | United Kingdom | 79.9 | 68.1 | 148 | 11.8 | 1.17 |
| 10 | India | 41.8 | 87.4 | 129.2 | -45.7 | 0.48 |
| 11 | Netherlands | 89.6 | 34.1 | 123.7 | 55.5 | 2.63 |
| 12 | Ireland | 16.5 | 103.2 | 119.7 | -86.7 | 0.16 |
| 13 | Italy | 32.4 | 76.3 | 108.6 | -43.9 | 0.42 |
| 14 | France | 43.5 | 59.9 | 103.4 | -16.3 | 0.73 |
| 15 | Brazil | 49.7 | 42.3 | 92 | 7.4 | 1.18 |
| 16 | Singapore | 46.0 | 43.2 | 89.2 | 2.8 | 1.06 |
| 17 | Switzerland | 24.9 | 63.4 | 88.3 | -38.4 | 0.39 |
| 18 | Thailand | 17.7 | 63.3 | 81.0 | -45.6 | 0.28 |
| 19 | Malaysia | 27.7 | 52.5 | 80.2 | -24.8 | 0.53 |
| 20 | Belgium | 34.1 | 27.8 | 61.9 | 6.3 | 1.23 |
| 21 | Australia | 34.6 | 16.7 | 51.3 | 17.9 | 2.07 |
| 22 | Spain | 23.9 | 21.2 | 45.1 | 2.6 | 1.13 |
| 23 | Indonesia | 10.2 | 28.1 | 38.3 | -17.9 | 0.36 |
| 24 | Israel | 14.8 | 22.2 | 37.0 | -7.4 | 0.67 |
| 25 | Colombia | 19.0 | 17.7 | 36.7 | 1.3 | 1.07 |
| 26 | Chile | 18.2 | 16.5 | 34.7 | 1.7 | 1.10 |
| 27 | Hong Kong | 27.9 | 6.0 | 33.9 | 21.9 | 4.65 |
| 28 | Saudi Arabia | 13.2 | 12.7 | 25.9 | 0.4 | 1.04 |
| 29 | Philippines | 9.3 | 14.2 | 23.5 | -4.9 | 0.75 |
| 30 | Russia | 0.5 | 3.0 | 3.5 | -2.5 | 0.17 |
| - | Top 30 trading | 1,778.5 | 2,930.2 | 4,708.7 | 1,151.8 | 0.61 |
| - | World | 2,065.18 | 3,267.39 | 5,332.57 | -1202.2 | 0.63 |