
I started this page at the beginning of 2025 when presidwent Trump was firing people and reducing department budgets in order to make the government more efficient. I knew several people who lost their jobs or funding for their research projects.
But, it wasn't effecting me in the short term; I'm retired and can put off visiting a national park.
I'm not worried about being deported, my 10th great-grandfather Joseph Cobb immigrated to Jamestown, Virginia Colony in 1613. My 8th great-grandfather, George Soule immigrated to the Plymouth Plantation in the Plymouth Colony in 1620 on the Mayflower. The Plymouth Colony merged with the Massachusetts Bay Colony in 1691.
The land owners then, the Wampanoag People, welcomed the immigrants and cooperated with them holding the first Thanksgiving.
However, loss of research for cancer cures could effect me in the future and climate change will certainly affect my 5 year old Grandson.
With the Fiscal Year 2025 budget in front of congress in June I am now starting to look at the bottom line, revenue less expenses; Will the savings make up for the loss of revenue with tax cuts or will our national debt increase because of annual deficits.
Interest payments on the national debt is our 3rd highest expense at $3 billion per day, 17% of total spending. That averages more than $8,000 per family per year. Double what is was 5 years ago because of higher interest rates.
There's also the issue of who's going to pay. Lower-income families would likely face a higher percentage of their income in taxes under the current budget proposal due to a combination of tax cuts disproportionately benefiting the wealthy and cuts in social programs that disproportionately impact lower-income households.
Contents: 2024 Spending | Fiscal Year 2026 proposal | Fiscal Year 2026 tax cut effects | History & Charts

Mandatory vs. Discretionary Spending:
Mandatory Spending: This category includes programs where spending is required by law, such as Social Security, Medicare, and Medicaid. These programs continue automatically unless Congress changes the underlying laws.
Discretionary Spending: This category includes programs where Congress decides how much to spend each year during the appropriations process. Examples include defense, education, and transportation.
This category includes programs where Congress decides how much to spend each year during the appropriations process. Examples include defense, education, and transportation.
Supplemental Spending These supplementals were often used to address urgent needs like disaster relief, national security concerns, or health emergencies, particularly in situations where the need for funding was too immediate to wait for the regular appropriations process.
e.g COVID-19 pandemic, military support for Ukraine, Israel, ...
Total spending in 2024 was $6.8 Trillion.
| Amount | % | Department | Employ- ees |
|---|---|---|---|
| $1.72 T | 25.5% | The Department of Health and Human Services (HHS) HHS includes Medicare, Medicaid, NIH, CDC and others. See below. | 81K |
| $1.52T | 22.5% | Social Security (SSA), (Administered by Treasury) | 59K |
| $1.13 T | 16.7% | Interest on debt of $35 Trillion (in TREAS budget) | |
| $912 B | 13.5% | The Department of Defense (DOD) 2024 budget | 775K |
| 848 B | 12.6% | Medicare in HHS See Agencies below for Medicaid | |
| The top 4 include 78% of total spending | |||
| $225 B | 3.3% | Other Department of the Treasury , (TREAS) expenses | 99K |
| $325 B | 4.8% | Department of Veterans Affairs (VA) | 433K |
| $268 B | 4.0% | Department of Education (Education Department, ED) | |
| $203 B | 3.0% | he Department of Agriculture (USDA) | 88K |
| $117 B | 1.7% | Department of Transportation | 54K |
| $89 B | 1.3% | The Department of Homeland Security (DHS) | 212K |
| $54 B | 0.8% | The Department of Labor (DOL) | 17K |
| $52 B | 0.8% | Department of Housing and Urban Development (HUD) | 10K |
| $49 B | 0.7% | The Department of Energy (DOE) | 16K |
| $44 B | 0.7% | The Department of Justice (DOJ, Justice Department) | 115K |
| $38 B | 0.6% | State Department | 30K |
| $17 B | 0.3% | The Department of the Interior (Interior, DOI) | 63K |
| $15 B | 0.2% | The Department of Commerce (DOC) | 41K |
| Amount | % | Type | Employ- ees |
| $4.1 T | 60.7% | Mandatory | |
| $1.8 T | 26.6% | Discretionary | |
| 900 M | 13.3% | Supplemental | |
| $6.78 T | 100% | Total | 2.1 M |
| Amount | % of National | Health and Human Services (HHS) | Department |
|---|---|---|---|
| Health and Human Services (HHS) | |||
| $848 B | 12.6% | Medicare | HHS |
| 584 B | 8.4% | Medicaid and Children's Health Insurance Program (CHIP) In addition states covered $326 billion in medicaid. | HHS |
| $94 B | 1.4% | Administration for Children and Families (ACF): | HHS |
| $48 B | 0.7% | National Institutes of Health(NIH): | HHS |
| $12 B | 0.2% | Centers for Disease Control and Prevention(CDC) | HHS |
| $3.6 B | 0.1% | Food and Drug Administration (FDA) | HHS |
| $9.4 B | 0.1% | Indian Health Service(IHS): | HHS |
| 10.8 B | 0.2% | Substance Abuse and Mental Health Services Administration(SAMHSA) | HHS |
| 0.0% | Administration for Strategic Preparedness and Response(ASPR): | HHS | |
| 19 B | 0.3% | Health Resources and Services Administration (HRSA) | HHS |
| Treasury | $1.1 T | 16.2% | Interest on debt | Treas |
| 12 B | 0.2% | Internal Revenue Service (IRS) | Treas |
| Department of Homeland Security (DHS) | |||
| $22 B | 0.3% | Immigration and Customs Enforcement (ICE) | DHS |
| $10 B | 0.1% | Customs and Border Protection (CBP) | DHS |
| Department of Defense (DOD) | |||
| $912 B | 13.5% | The Department of Defense (DOD) 2024 budget | 775K |
| $9.7B | 0.1% | U.S. Army Corps of Engineers (USACE) | 25K |
| $165 B | 2.4% | Army | 453K |
| $205 B | 3.0% | Navy | 347K |
| $ 185 B | 2.7% | Air Force | 300K |
| $ 53 B | 0.8% | Marines | 160K |
| Department of Commerce (DOC) | |||
| $6.7 B | 0.1% | National Oceanic and Atmospheric Administration (NOAA) | DOC |
| Department of Agriculture (DOA) | $9.3 B | 0.1% | US Forest Seervice (USFS) | DOA |
The budget for the entire White House is not available to the public with the same level of detail as other government agencies.
This office, often referred to as the West Wing, includes the President's immediate staff and advisors, including the White House Chief of Staff, the Press Secretary, and various advisors on policy and communication.
Others in the Office of the president:
National Economic Council (NEC)
Domestic Policy Council (DPC)
Office of Science and Technology Policy (OSTP)
Community Development Financial Institutions (CDFI)
I'm sure there are operations and maintenance functions also, but couldn't find any details.
| Billion | % | Agency Commission ... |
|---|---|---|
| $67 | 1.0% | aid to Ukraine |
| $33 | 0.5% | Small Business Administration |
| $25.0 | 0.4% | NASA |
| $21.7 | 0.3% | Federal Trade Comission |
| $21.7 | 0.3% | USAID |
| $17.8 | 0.3% | The Federal Communications Commission (FCC) |
| $14.2 | 0.1% | Occupational Safety and Health Review Commission (OSHA) ) |
| $13.7 | Environmental Protection Agency (EPA) | |
| $9.4 | 0.1% | National Science Foundation (NSF) |
| $1.2 | 0.0% | AmeriCorps - The Corporation for National and Community Service (CNCS) |
| $0.5 | 0.0% | Equal Employment Opportunity Commission (EEOC) |
| $0.48 | 0% | Peace Cprps |
| $0.37 | 0.0% | The Commodity Futures Trading Commission (CFTC) |
| $0.22 | 0.0% | The Federal Trade Comission (FTC) |
| $0.139 | 0.0% | National Transportation Safety Board |
| $0.03 | 0.0% | Federal Maritime Commission (FMC) |
| $0.03 | 0.0% | Administrative Conference |
Source: 2024 government revenue and spending | usafacts.org
 USA Facts was created by Steve Balmer former CEO of Microsoft. See video
In fiscal year 2024, Medicaid—which provides medical coverage for eligible children, adults, people with disabilities, and older Americans—accounted for 68.8% of total federal grants to states and was the largest source of federal funding in all but one state.
Other funds were divided into five other broad policy areas. Grants such as the Temporary Assistance for Needy Families and the National School Lunch Program that focus on income security for individuals and families in need made up 11.3% of total federal dollars to states, making them the second-largest source of federal funding in 39 states. Transportation funding followed, comprising 7.6% of total federal grants (and serving as the second-largest source in nine states). Education (5%), other health (4.4%), and everything else (2.8%) made up smaller shares.
States and the Federal Government contribute to the Federal Unemployment Account (FUA). States can borrow from the FUA if they don't generate enough tax revenue to cover benefits. In 22024 the federal government contributed 360 million (5%)to the FUA.
Mandatory Spending: This category includes programs where spending is required by law, such as Social Security, Medicare, and Medicaid. These programs continue automatically unless Congress changes the underlying laws.
Discretionary Spending: This category includes programs where Congress decides how much to spend each year during the appropriations process. Examples include defense, education, and transportation.
Supplemental Spending These supplementals were often used to address urgent needs like disaster relief, national security concerns, or health emergencies, particularly in situations where the need for funding was too immediate to wait for the regular appropriations process.
e.g Disaster relief, national security concerns, or health emergencies,
2024:
Public Law No: 118-50 (04/24/2024
Military assistance to Ukraine, Israel, and U.S. allies in the Indo-Pacific region.
Migration and Refugee Assistance,
International Narcotics Control and Law Enforcement.
Medicare: 14% of the federal budget in FY 2024.
It cuts spending on social programs like Medicaid and makes it more difficult for Pell Grant recipients to qualify. It also cuts education programs, green energy initiatives, and nutrition assistance. Agencies like NIH (37%), CDC (43%), NOAA (25 %), and Forest Service (22%), National Parks (30%), National Endowment for the arts (NEA)(100%), and others...
However tax cuts will increase the national debt by $2.4 to $3 trillion over the next 10 years. 8% of the current debt of $36 trillion.
Regan had to roll back his tax cuts in his 3rd year because of the increased debt.
Employment:
As of June 1st 2025 the Department of Government Efficiency (DOGE) has led to the layoff of over 200,000 federal workers, including those who accepted buyouts or took early retirement. Additionally, over 75,000 federal workers agreed to deferred retirement.
A 275,000 (13%) reduction.

The new budget includes considerations of extending parts of the sweeping Tax Cuts and Jobs Act (TCJA) enacted in Trump's first term.
US government income tax revenue is expected to be $4.5 trillion, a decrease of 10% from the previous year.
The argument is that consumer spending and business investment could increase, boosting demand and potentially leading to a temporary rise in economic output.
This is the same argument Reagan used in 1980, but he had to roll back tax cuts in his third year because of increased deficits.
Tariffs could make up some of the difference, but tariffs are effectively another form of tax, increasing the cost of goods that everyone relies on.
Household Income:
Lower-income households: Expected to see income decrease due to losses in Medicaid, Affordable Care Act premium support, and food stamps, which are projected to outweigh any benefits from tax cuts on tips or other tax reductions.
High-income households: Expected to receive larger income boosts. The bill includes provisions like the expanded State and Local Tax (SALT) deduction.

Historical Spending as a percent of Gross Domestic Product (GDP).
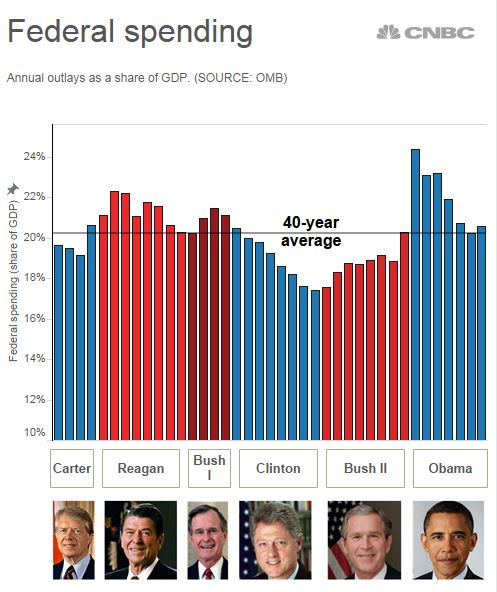
When the Great Recession (2007-2009)sent the economy in reverse, GDP went down, so spending as a share of GDP soared when Obama took office, but came back in line with historical trends.

The last time the budget was balanced was in 199 by Lyndon Johnson.
In 2008-2009 the ratio went up because GDP went down due to the Great Depression (Financial Chrisis)
In 2020-2022 it went up because of COVID.
2015-2023


 USA Facts was created by Steve Balmer former CEO of Microsoft. See video
2025 Report is at FiscalData | treasury.gov
I could not find the 2024 data at that site. THe 2024 numbers above are from other sources.
A-Z index of U.S. government departments and agencies
