 California
San Mateo County
California
San Mateo County
| Don's Home
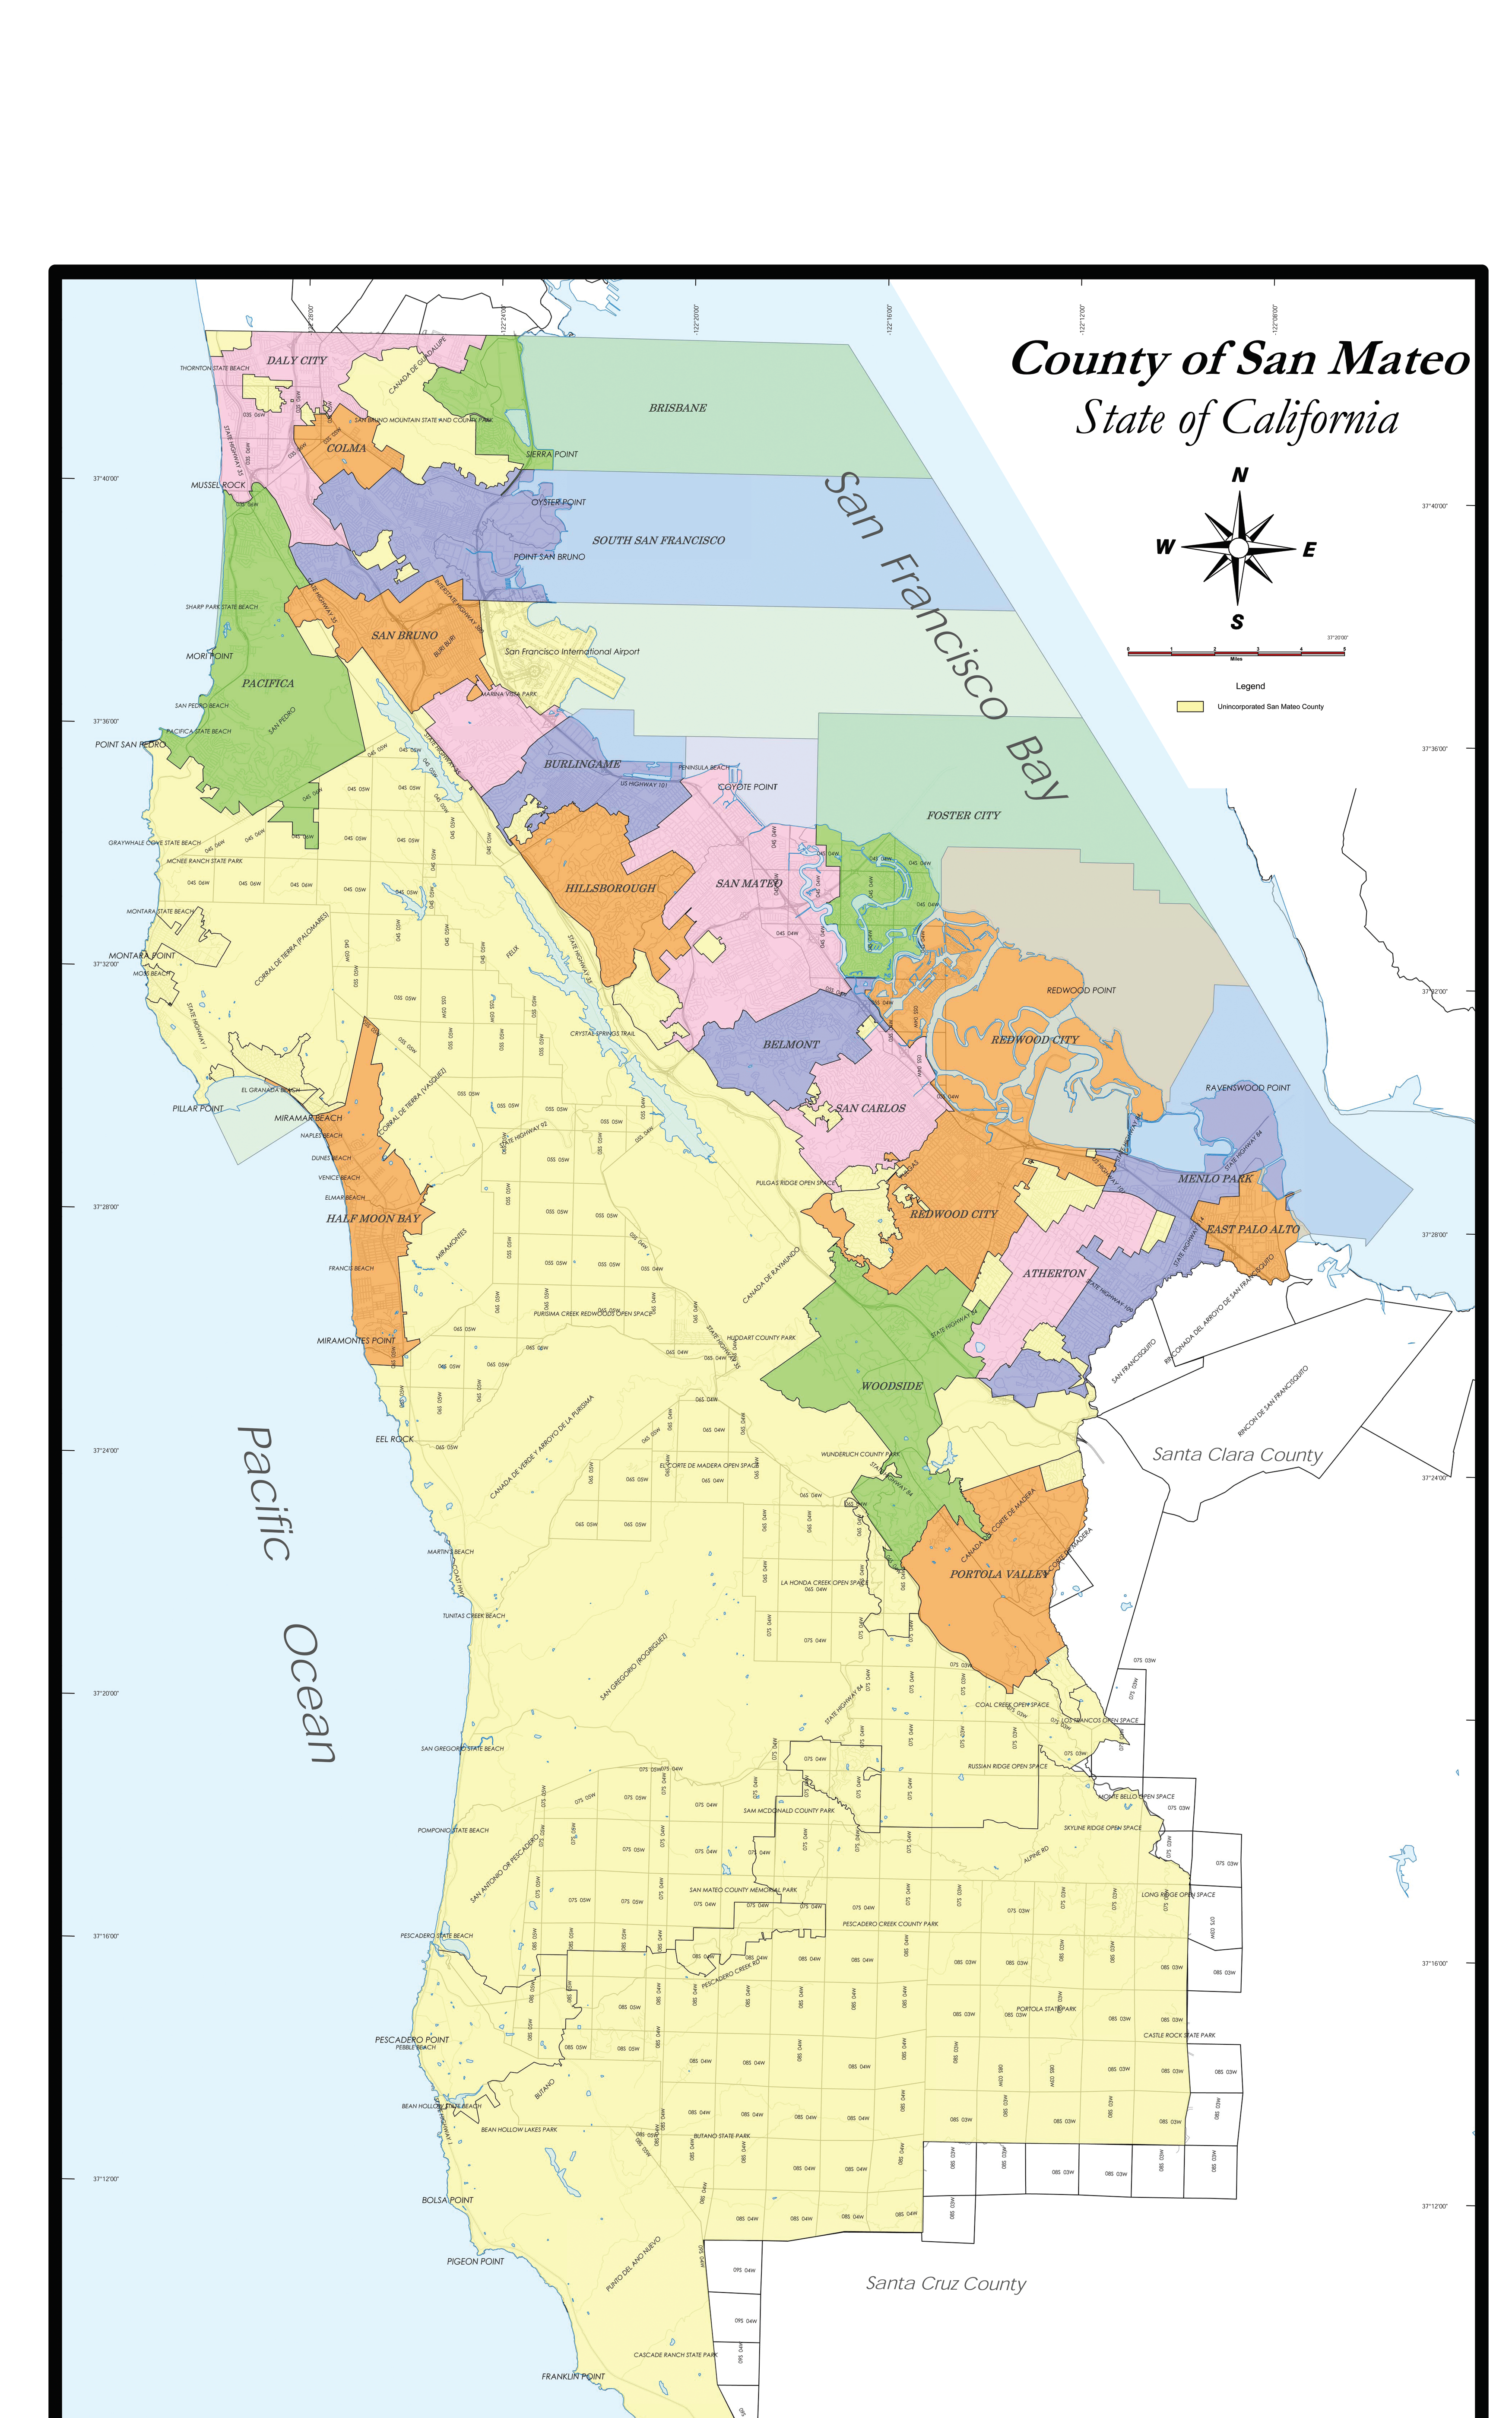
California
San Mateo County
|
| City | Population | Median home $M 2021 |
|---|---|---|
| Atherton | 6,914 | $7.5M |
| Belmont | 25,835 | $2.2M |
| Brisbane | 4,282 | |
| Broadmoor | 4,176 | |
| Burlingame | 28,806 | $2.2M |
| Colma | 1,792 | |
| Daly City | 101,123 | $1.1M |
| East Palo Alto | 28,155 | |
| El Granada | 5,467 | |
| Emerald Lake Hills | 4,278 | |
| Foster City | 30,567 | $1,4M |
| Half Moon Bay | 11,324 | $1.6M |
| Highlands-Baywood Park | 4,027 | |
| Hillsborough | 10,825 | $4.6M |
| La Honda | 928 | |
| Ladera | 1,426 | |
| Loma Mar | 113 | |
| Menlo Park | 32,026 | $2.8M |
| Millbrae | 21,532 | $2.0M |
| Miramar | ||
| Montara | 2,909 | |
| Moss Beach & seal cove | 3,103 | |
| North Fair Oaks | 14,687 | |
| Pacifica | 37,234 | $1.3M |
| Pescadero | 643 | |
| Portola Valley | 4,353 | $3.6M |
| Princeton-by-the-sea | 297 | |
| Redwood City | 76,815 | $1.8M |
| San Bruno | 41,114 | $1.4M |
| San Carlos | 28,406 | $2.4M |
| San Mateo | 97,207 | $1.4M |
| South San Francisco | 63,632 | $1.2M |
| West Menlo Park | 3,659 | |
| Woodside | 5,287 | $4.2M |
Financial Santa Clara California US Median household income (2019 dollars) (CPS) $122,641 Median Household income ACS | Data USA) $138,500 $80,440 $65,712 Santa Clara County is #2 in Household Income out of 3,144 counties in the country. The top 5 are Loudoun Co, VA; San Mateo Co, CA; Santa Clara co, CA; Farfax Co, VA; San Francisco Co, CA.
Somerset Co., NJ has dropped to #15. Still in the top 1% nationally.
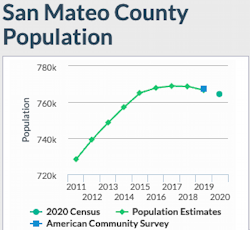
See: List of highest-income counties in the United States - Wikipedia Per capita income in past 12 months 2015-2019 $61,545 Persons in poverty 5.5% Population April 1, 2020 764,442 April 1, 2010 718,451 6.4% increase Between 2018 and 2019 the population declined from 769,545 to 766,573, a 0.386%
Population Age
< 5 5.5%
< 18 20.2%
> 65 16.6%


Race             Santa Clara                 California  US
White alone                            59.5%     34.7%    57.8
Black or African American alone        2.8%
American Indian and Alaska Native alone 0.9%
Asian Alone                            30.6%     15.1
Pacific Islander alone 1.5%
2 or more races 4.8%
Hispanic or Latino                    24.0%      39.4
White alone, not Hispanic or Latino	38.7%
U.S. Census Bureau QuickFacts: San Mateo County, California
CALIFORNIA: 2020 Census

Immigrants
As of 2019, 34.9% of San Mateo County, CA residents (267k people) were born outside of the United States, which is higher than the national average of 13.7%.

Housing
Median value of owner-occupied housing units, 2015-2019  $1,089,400
Median gross rent, 2015-2019  $2,316
Education
Bachelor's degree or higher  51.0%
U.S. Census Bureau QuickFacts: San Mateo County, California
Two San Mateo neighborhoods are listed in the top 10 richest neighborhoods (based on median family income) in the US.
1. Billionaires Row, New York City, New York
 (Area near Central Park. West 57th st, Park Ave.)
2. Short Hills, Millburn Township,New Jersey
3. West Menlo Park, Atherton Town, California
4. Almaden, Silicon Valley, California
5. Potomac Manors, Potomac, Maryland
6. English Village, Mountain Brook, Alabama
7. The Golden Triangle in Greenwich, Connecticut($152,577)
8. Upper East Side, Manhattan New York
9. Brewer Subdivision, Hillsborough, California
10. Crestline Heights, Mountain Brook, Alabama
Top 13 Richest Neighborhoods in the US [Report 2022]