 New Jersey
 Cultural Map (Cultural and Ethnic Stereotypes)
New Jersey
New Jersey Cultural Map (Cultural and Ethnic Stereotypes)
| Home
New Jersey
New Jersey Cultural Map (Cultural and Ethnic Stereotypes)
|
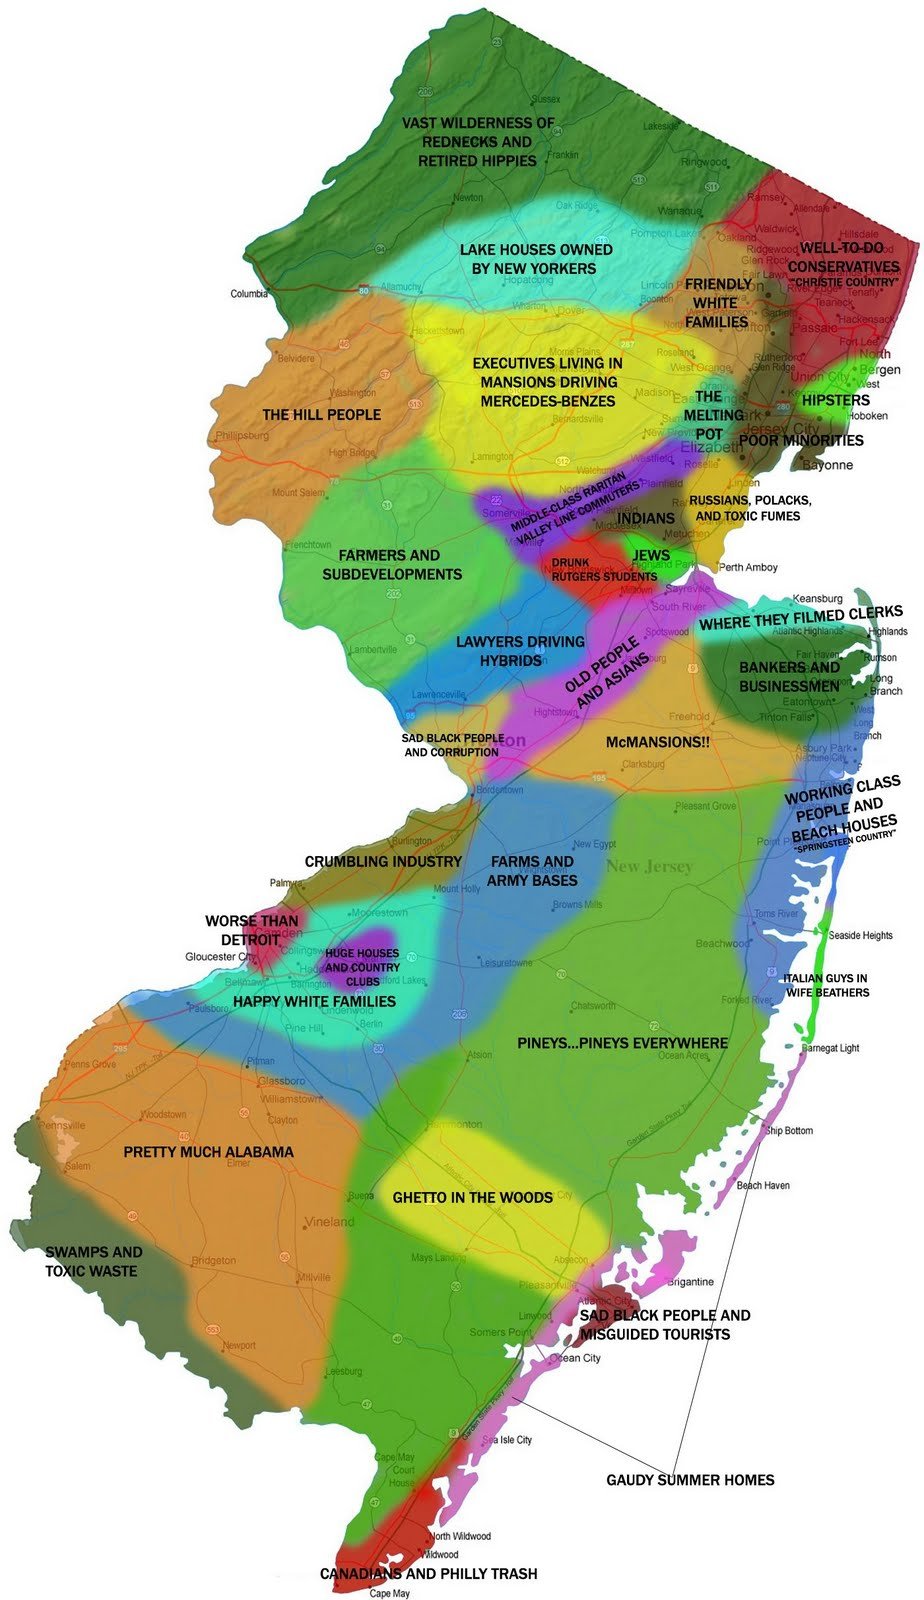 In December, 2011, 22 year old Rutgers graduate, Joe Steinfeld from Westfield, published this color coded map of New Jersey which went viral on the web. Most people thought it was funny with titles like "rednecks, hippies and misguided tourists", but mayors in areas with titles like "Sad black people and corruption", "Worse than Detroit" or "Russians, Polacks and Toxic Fumes" were not very happy. In a Star Ledger poll 9% said they were offended. Keywords: New Jersey Cultural Map, NJ, New Jersey, Regional Stereotypes, cultural and economic stereotypes, color coded map of New Jersey, Vast Wilderness of Rednecks and Retired Hippies, Well-To-Do Conservatives, Christie Country, hippies, misguided tourists, executives living in mansions, lake houses owned by new yorkers, farmers and subdevelopments, Executives living in mansions driving Mercedes-benzes, Middle-class raritan valley line commuters, Farms and army bases, Pineys ... Pineys Everywhere, Ghetto In The Woods, Sad Black People And Corruption, worse than detroit, camden, detroit, raritan valley. Snobbiest Towns at RoadSnacks
articles about the map: Map divides New Jersey into regional stereotypes | The Sideshow - Yahoo! News N.J. man puts rednecks, hippies and misguided tourists on the map | NJ.com Man Marks 'Misguided Tourists,' 'Philly Trash' on NJ Map | NBC 10 Philadelphia Demographics: New Jersey is the 11th most populated state with 8.8 million people in 2010 and a growth rate of 0.6% per year (28th). See New Jersey QuickFacts from the US Census Bureau New Jersey is the most densely populated state with 1,189 inhabitants per square mile. Ethnic diversity: New Jersey is one of the most ethnically and religiously diverse states in the country - Wikipedia The largest ethnic groups are: Hispanic (18%), Italian (17.9%), Irish (15.9%), African (13.6%), German (12.6%), Asian (8.2%) and Polish (6.9%).
Income: See Demographics for more
Camden had the highest crime rate in the U.S. with 2,333 violent crimes per 100,000 people while the national average was 455 per 100,000.
New Jersey's income inequality index (Gini) was below the national index (good).
|