Under Construction 
See also How to Invest Like a Quant.
Analysis of price movements and trading volumes rather than Fundamental analysis. Technical analysts typically use charts produced by computer tools like Telechart at worden.com or stockcharts.com or thinkorswim which calculate things like:
- Moving averages: 50, 200, ... day moving average, simple (SMA), Exponental, Weighted, ...)
- Volitility Indicators: Bollinger Bands
- Momentum Indicators: Stochastic, Relative Strength
- Trend Indicators: Average Directional Index (ADX), Moving Average Convergence/Divergence (MACD)
- Oscillators: Stochastic, McClellan, ADX,
- Other: Acceleration Indicators, Fibonacci retracement levels, Elliot waves
- Price patterns: trading channels, hockey stick, cup with handle, Head and Shoulder Formations, candlestick charts, etc.
- Super Bowl Results
See Technical Indicators at StockCharts.com
Investor's Business Daily also computes several technical scores for stocks.
Although technical analysts fell out of favor as studies questioned their forecasting powers, increased access to information and the growing power of computers have led to a resurgent interest.
Here is a sample of a technical indicator from Telechart. Telechart also produces charts like this for individual stocks.
The McClellan Summation Index
(a popular market breadth indicator that is ultimately derived from the number of advancing and declining stocks in a given market) is shown below for Mar 6., 2007. Current values at StockChars.com
The large red line (McClellan Index) at the right in the upper window (the steepest in several years) put a big scare into the technical investors. The market dropped 3.5% on Feb. 27 on high volume and dropped another 1.8% less than a week later.
Time Segmented Volume (TSV) (the purple line in the center window) never goes below the bottom Bollinger band (BBande) (green) during an up market, but it is now.
By Mar. 30 the S&P was up 3.5% from it's low, but was trading sideways.
See 2006-07 chart on the investing page.
Other proprietary technical systems such as Neuroquant, based on artificial neural network (ANN) software,
and PrimeMarketSignal.com are available by subscription.
Some popular guidelines:
Setting a stop loss:
- Set stop at the highest daily low in the last 15 days starting 3 days ago.
- Set it to 4 ATR below the current price (for long-term trading)
- Set it to the 8 day exponential moving average (EMA)
Three ticks below the low of the most recent one to two pivots.
Never ever move a stop against your position (down on a long position). This is a common mistake of novice investors.
Buy indicators:
They all have different rules for selecting stocks, a couple of the
favorites are:
-
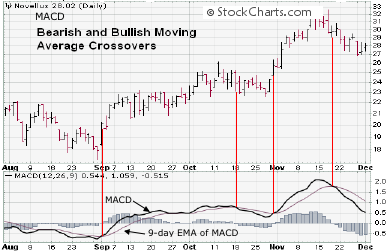 Buy when the Moving Average Convergence Divergence - MACD
(12,26,9) rises above the signal line. Buy when the Moving Average Convergence Divergence - MACD
(12,26,9) rises above the signal line.
The standard MACD is calculated by subtracting the 26-day exponential moving average (EMA) from the 12-day EMA. A nine-day EMA of the MACD, called the "signal line", is then plotted on top of the MACD, functioning as a trigger for buy and sell signals.
The shorcut for this version is 12,26,9 MACD. (Sometimes indicated as 9,26,12)
12,26,9 was the recommended option but other options are used also.
The 5,35,5 MACD was made popular by Chris Manning, who uses it to identify major market divergence points.
Technical investors experiment with values which generate signals at points where other indicators show a market turn for their style of investing. One setting used by some intermediate term investors is 5,15,10.See: investopedia.com and StockCharts.com
- Buy when the 8 day EMA rises above the longer term (some use 20 day others use 30 day) MA.< BR>
SEE StockCharts.com
- Candle stick analysis.
The Japanese began using technical analysis to trade rice in the 17th century and candlestick charting evolved from this.
The thick part of the candlestick line is called the real body. It represents the range between the session opening and closing prices. If the real body is black or red, it means that the close of the session was lower than the open. If the real body is green or white, it means that the close was higher than the open. The lines above and below the body are the shadows (also referred to as "wicks" and "tails") which represent the session price extremes. The shadow above the real body is called the upper shadow and the shadow below the real body is called the lower shadow. The top of the upper shadow is the high of the day, and the bottom of the lower shadow is the low of the day.
The candle will be filled in red if the stock goes down that day and closes lower than the previous days close. It will be filled in black if the price closes lower than the open, but still manages to close above the previous days close.
There are currently 40 or more candlestick patterns which indicate market reversals (bullish or bearish), things like doji, hammer, hanging man, shooting star, ...
See: introduction_to_candlesticks at stockcharts.com
- Price Channels:
Buy when the stock price breaks thru its 20 day high or sell when it breaks thru its 20 day low.
See StockCharts.com
- Cup and Handle:
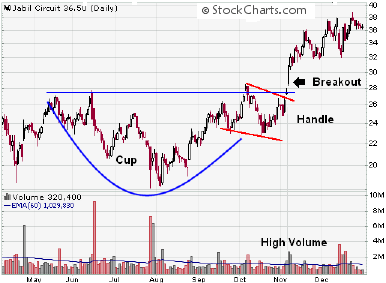 A pattern on bar charts resembling a cup with a handle. The cup is in the shape of a "U" and the handle has a slight downward drift. The right-hand side of the pattern has low trading volume. It can be as short as seven weeks and as long as 65 weeks.
As the stock comes up to test the old highs, the stock will incur selling pressure by the people who bought at or near the old high. This selling pressure will make the stock price trade sideways with a tendency towards a downtrend for four days to four weeks... then it takes off.
During the handle formation, the volume decreases as small investors get out. However, you will notice an increase in volume when the price breaks out beyond the right side of the cup as institutional investors get in.
See StockCharts.com
Many technical investors feel the large
(institutional investors) manipulate prices to cause their rules to
signal trades. e.g. dump stock quickly to cause these technical
indicators to signal sells, then jump back in after they've all
panicked lowered the price temporarily. That's one explanation for some of the short term anomalies you see.
Online Forums - tutorials ...:
TchartsNchat.com
Terms:
See: Glossary
Books:
The New Fibonacci Trader: Tools and Strategies for Trading, 2001, Fischer
The Ultimate Trading Guide, 2000, Hill, Pruitt, Hill
Links:
Indicators at TraDecision.com
Introduction to Market Indicators at StaockCharts.com
Technical Analysis with Tim Knight (Blog)
Technical Analysis at DMOZ
Well Known Chart Patterns
Stock Technical Analysis at stockta.com
Elliott Wave Tutorial
Return to Investing
last updated 20 Mar 2008
|
