Source: SierraAtTahoe
| Tahoe Snow | |
|---|---|
| Tahoe > Weather > |
Contents: Current Information | Historical Data | Daily Forecasts
Source: SierraAtTahoe
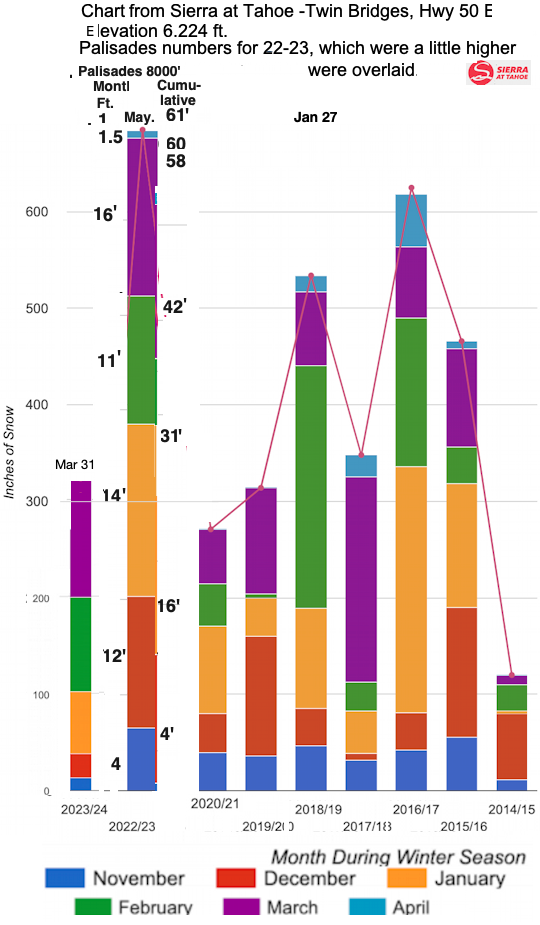
2022-23 PalisadesTahoe Base vs Top levels.
| Location | NOV | DEC | JAN | FEB | MAR | APRIL | MAY | TOTAL* |
|---|---|---|---|---|---|---|---|---|
| Village 6200 | 2.3' | 5.3' | 9.2' | 6.7' | 8.5' | 0.6' | 32.5' | |
| Palisades 8000 | 4.2' | 12.2' | 14.3' | 11.0' | 15.9' | 1.5' | 1' | 60.1' |
| Increase | 85% | 128% | 56% | 65% | 87% | 157% | 82% |
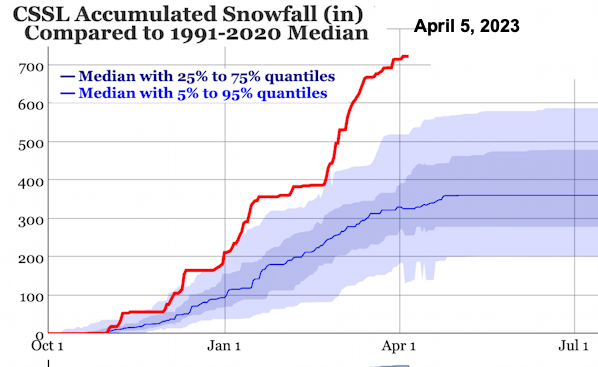
The UC Berkley Central Sierra Snow Lab is the is the most often quoted source. They measure accumulated snowfall and snow water content.
The depth on April 1st is the official count for the year.
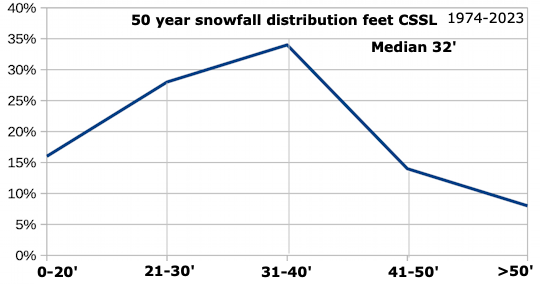
The median is 314 inches (or 27.5 ft), which is 315 inches at Sierra at Tahoe.
Which is a Snow Water Equivalent (SWE) of 36.
now Water Equivalent is the amount if water that cab be obtained from the snowpack.
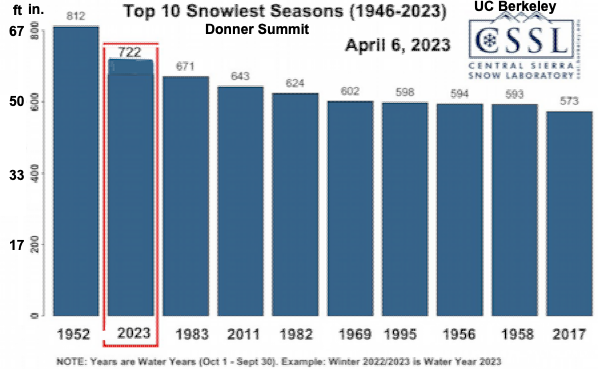
With a total snowfall of 60 feet as of April 4th, 2023 became the 2nd snowiest season since 1946 when the Central Sierra Snow Lab (CSSL) was established by UC Berkeley at Donner summit. They passed 1983 with 56 feet for the season but will probably not reach number 1 passing 1952 with 68 feet. The most snow in April recently was 4½ feet in 2017.
Source: UCB CSSL | Facebook
Last 36 years sorted by depth (feet):
|
|
|
| 1990 | 91 | 92 | 93 | 94 | 95 | 96 | 97 | 98 | 99 | 2000 | 01 | 02 | 03 | 04 | 05 | 06 | 07 | 08 | 09 | 10 | 11 | 12 | 13 | 14 | 15 | 16 | 17 | 18 | 19 | 20 | 21 | 22 | 23 |
| CSSL Snowfall | |||||||||||||||||||||||||||||||||
|---|---|---|---|---|---|---|---|---|---|---|---|---|---|---|---|---|---|---|---|---|---|---|---|---|---|---|---|---|---|---|---|---|---|
| 26 | 28 | 20 | 42 | 21 | 50 | 27 | 23 | 44 | 39 | 29 | 29 | 32 | 33 | 31 | 40 | 35 | 23 | 29 | 30 | 42 | 54 | 27 | 18 | 16 | 11 | 31 | 48 | 22 | 41 | 32 | 23 | 33 | 60 |
| CSSL Maximum Depth | 8.2 | 8.2 | 6.8 | 14.2 | 7.4 | 16.0 | 8.8 | 10.5 | 13.1 | 13.3 | 10.7 | 7.8 | 9.2 | 8.0 | 10.7 | 10.2 | 12.3 | 8.6 | 10.2 | 10.3 | 9.5 | 18.5 | 7.6 | 6.7 | 4.4 | 2.6 | 9.5 | 15.2 | 7.6 | 14.9 | 8.3 | 7.5 | 10.0 | 17.0 |
| Ratio Max Depth % of snowfall - Range 25% - 37% | |||||||||||||||||||||||||||||||||
| 31% | 30% | 34% | 34% | 36% | 32% | 32% | 45% | 30% | 34% | 37% | 27% | 29% | 24% | 34% | 25% | 35% | 38% | 35% | 34% | 22% | 35% | 28% | 37% | 27% | 24% | 30% | 32% | 34% | 36% | 26% | 33% | 30% | 28% |
Central Sierra Snow Lab - Donner Summit | cssl.berkeley.edu 2023
Click on the charts below to get a current version.
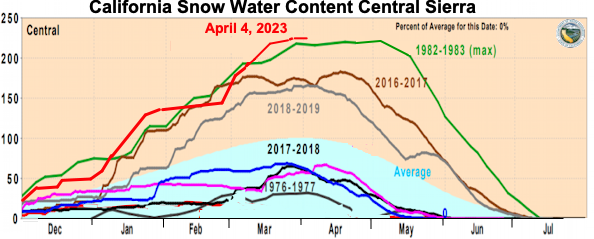
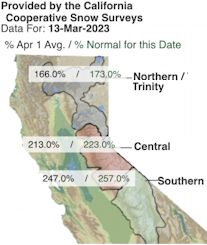
As of March 13, 2023 the Snow Water Content for the Central Region was the highest since the California Department of Water Resources has been tracking it starting in 1976-1977. 223% of normal
Snow Water Content History Chart | California Data Exchange Center | CA Department of Water Resources
| State Water Project and Central Valley Project | CA Department of Water Resources
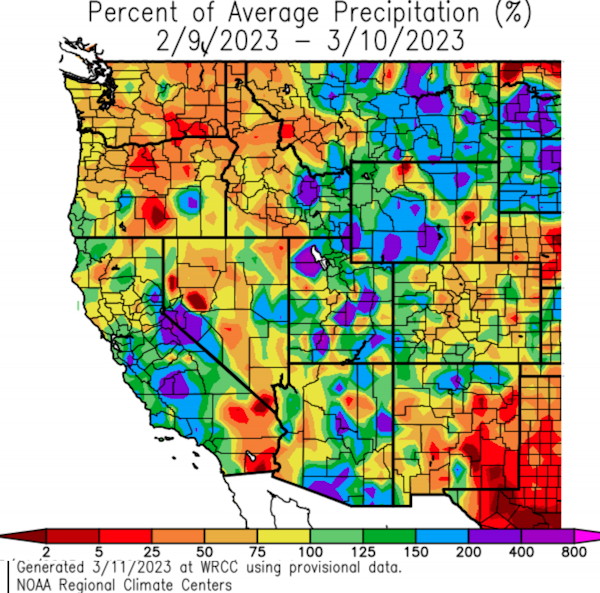
Percent of Average precepition Map |Western Regional Climate Center (WRCC) - Reno
Total Snowfall and Maximunm Depth at Central Sierra Snow Lab
Click on the image below for 1880 - 2020
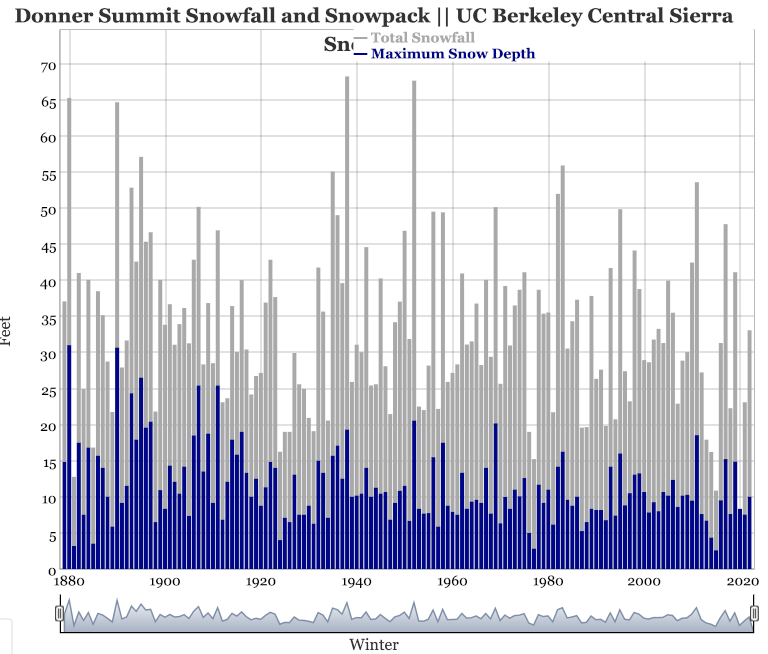
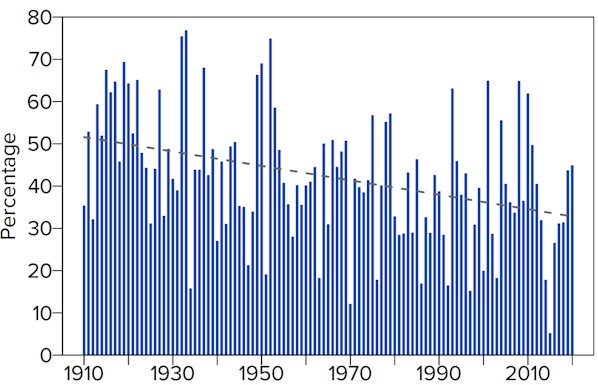
I did the following statistical analysis to determine if the rate of decrease is increasing (i.e. if there is more decrease in snowfall over the last 40 years than there was in the previous 40 years) and if there was more variation (higher highs and lower lows) over time (STDDEV: standard deviation).
Units - Feet.
| Date | Snowfall | Depth | ||||||
|---|---|---|---|---|---|---|---|---|
| 13 yr average | change | 40 yr. average | Change | Std-dev | 40 yr. average | Change | Std-dev | |
| 1901-1940 | 33.1* | 12.7 | ||||||
| 1940 | 35.2 | |||||||
| 1941-1980 | 33.8 | 2.2% | 10.2 | 10.2 | -19.3% | 3.7 | ||
| 1980 | 33.5 | -4.8% | ||||||
| 1981-2020 | 32.0 | -5.2% | 10.6 | 9.9 | -3.5% | 3.3 | ||
| 2020 | 30.9 | -7.8% | ||||||
| SEASON | OCT | NOV | DEC | JAN | FEB | MAR | APRIL | May | TOTAL* |
|---|---|---|---|---|---|---|---|---|---|
| Inches | |||||||||
| 2022-2023 | 1" | 50" | 146" | 172" | 132" | 191" | 18" | 12"† | 700" |
| 2021-2022 | na | 8" | 212" | 4" | 20" | 20" | 86" | na | 350" |
| 2020-2021 | 38" | 45" | 86" | 48" | 57" | 9" | 281" | ||
| 2019-2020 | 40" | 113" | 57" | 3" | 137" | 25" | 374" | ||
| 2018-2019 | 56" | 43" | 136" | 310" | 83" | 25" | 652" | ||
| 2017-2018 | 24" | 11" | 48" | 45" | 237" | 21" | 386" | ||
| 2016-2017 | 48" | 41" | 274" | 193" | 89" | 62" | 707" | ||
| 2015-2016 | 54" | 129" | 128" | 40" | 141" | 27" | 518" | ||
| 2014-201" | 22" | 83" | 2" | 43" | 23" | 37" | 209" | ||
| 2013-2014 | 10" | 26" | 14" | 99" | 66" | 52" | 266" | ||
| 2012-2013 | 65" | 127" | 11" | 13" | 39" | 13" | 267" | ||
| 2011-2012 | 12" | 0" | 40" | 39" | 127" | 58" | 276" | ||
| 2010-2011 | 104" | 157" | 19" | 134" | 215" | 48" | 678" | ||
| 2009-2010 | 26" | 91" | 107" | 45" | 75" | 97" | 424" | ||
| 2008-2009 | 9" | 112" | 40" | 103" | 84" | 18" | 383" | ||
| 2007-2008 | 25" | 56" | 148" | 88" | 20" | 14" | 335" | ||
| 2006-2007 | 0" | 49" | 13" | 105" | 17" | 39" | 248" | ||
| 2005-2006 | 20" | 70" | 107" | 47" | 177" | 104" | 504" | ||
| 2004-2005 | 21" | 86" | 125" | 54" | 97" | 25" | 406" | ||
| 2003-2004 | 21" | 127" | 47" | 87" | 15" | 14" | 311" | ||
| 2002-2003 | 43" | 150" | 18" | 24" | 25" | 112" | 372" | ||
| 2001-2002 | 40" | 129" | 50" | 30" | 93" | 27" | 369" | ||
| 2000-2001 | 20" | 30" | 45" | 116" | 33" | 62" | 305" | ||
| † May 2022-23 is forecast as of May 5 | |||||||||
| SEASON | NOV | DEC | JAN | FEB | MAR | APRIL | TOTAL* | ||
| Feet | |||||||||
| AV | 2.7' | 7.4' | 6.1' | 6.6' | 7.5' | 3.6' | 33.8' | ||
| MAX | 9' | 18' | 23' | 26' | 20' | 9' | 59' | ||
| MIN | 0.0' | 0.0' | 0.2' | 0.3' | 1.3' | 0.7' | 17.4' | ||
Difference between the base and the top of the resort 2022-23 season.
| Location | NOV | DEC | JAN | FEB | MAR | APRIL | MAY | TOTAL* |
|---|---|---|---|---|---|---|---|---|
| Village 6200 | 2.3' | 5.3' | 9.2' | 6.7' | 8.5' | 0.6' | 32.5' | |
| Palisades 8000 | 4.2' | 12.2' | 14.3' | 11.0' | 15.9' | 1.5' | 1' | 60.1' |
| Increase | 85% | 128% | 56% | 65% | 87% | 157% | 82% |
Tahoe Daily Snow - Donner Summit Snowfall and Snowpack | opensnow.com 1879-2017
Monthly Precipitation Report | National Weather Service NOAA
Tahoe Daily Snow Forecasts | opensnow
PalisadesTahoe | Heavenly | NorthStar | Boreal | Sugar Bowl | Tamarack | Mt Rose Ski Tahoe
Homewod Snow Forecast | opensnow
Homewood | Weather Underground
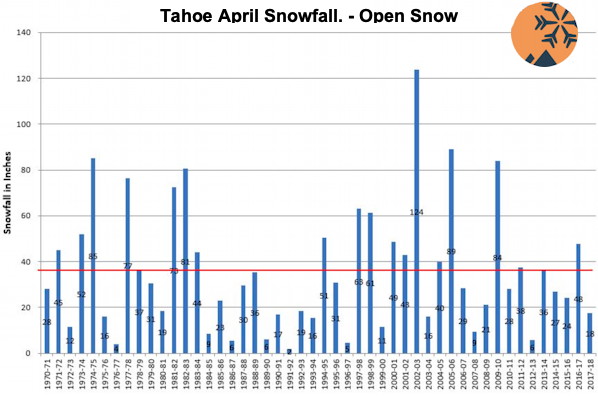
January, February, March and the beginning of April are the best ski months.
1 year in 10 will have snow at Thanksgiving.
The end of December and end of April will have decent skiing 60% of the time.
Smaller areas close at the beginnig of April, larger areas stay open till May. See ski page.
1 year in 10 will have decent snow in May.
Earliest snow:
| 2003 | 2004 | 2005 | 2006 | 2007 | 2008 | 2009 | 2010 | |
|---|---|---|---|---|---|---|---|---|
| Tahoe City | 10/30 | 10/17 | 11/25 | 11/12 | 12/4 | 11/4 | 11/21 | 11/9 |
| Soda Springs | 11/4 | 11/12 | 12/4 | 11/4 | 10/14 | 11/8 |
| 2003 | 2004 | 2005 | 2006 | 2007 | 2008 | 2009 | 2010 | 2011 | |
|---|---|---|---|---|---|---|---|---|---|
| Tahoe City | 5/8 | 4/1 | 4/17 | 4/20 | 5/14 | 5/20 | |||
| Soda Springs | 6/4 | 5/9 | 5/12 | 5/17 | 6/13 | 7/1 |
Snow Depth
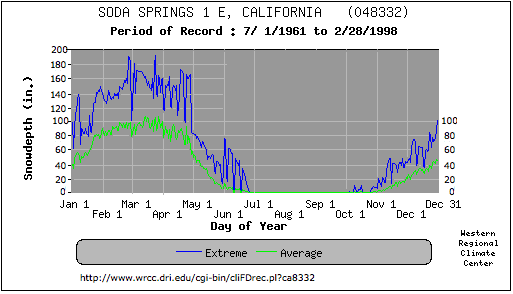
Source: Western Regional Climate Center - Desert Research Institute
Snow Depth at various Calif. locations
Northern California at the National Weather Service by the U. Utah
Truckee-Tahoe (KTRK)
Lab near Soda Springs (5 day precip)
Meyers
More Snowfall Information below
Other forecast links:
Lake Tahoe Web Cams | Tahoetopia
See also Soda Springs Snow Depth charts 2006-2011
Lake Tahoe Air Temperature:
Over the last 109 years, daily air
temperatures measured at Tahoe City
have increased. The long-term trend in
average daily minimum temperature
(bottom figure) has increased by 4.49
°F (2.49 °C) and the long-term trend in
average daily maximum temperature
(upper figure) has risen by 2.22 °F (1.23
°C). The trend line for the minimum air
temperature has exceeded the freezing
temperature of water for the last 15 years,
leading to more rain and less snow as
well as earlier snowmelt at Lake Tahoe.
These data are smoothed using a twoyear running average to remove daily and
seasonal fluctuations.
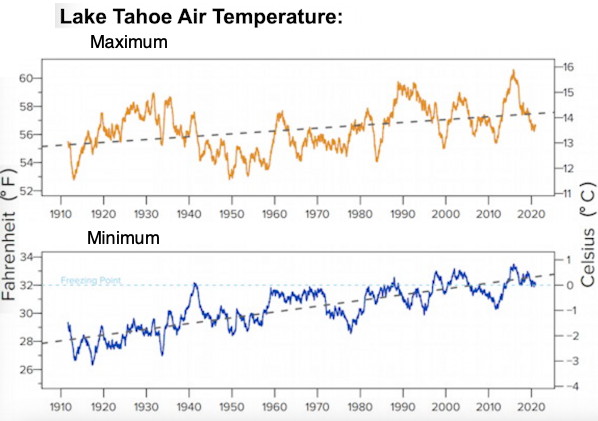
Source: Tahoe Environmental Research Center Meteorology 2021
Historical data from Informative Ski Reports and Other Ski Links by Tony Crocker
Tahoe National Forest Snow Report
California Snowpack Conditions (History of Snow Surveying) at the Dept. of Water Resources (cdec.water.ca.gov)
Historical Climate Information at the Western Regional Climate Center part of the Desert Research Institute (DRI) (www.wrcc.dri.edu/rcc.html)
Donner Summit:
| Mon | Average Av. '61-'98 | Snow Depth (in) (Begining of month) |
||||
|---|---|---|---|---|---|---|
| Soda Springs | Castle Creek | Donner Summit | ||||
| Snowfall | Depth | 2005-6 | 2006-7 | 2005-6 | 2006-7 | |
| Nov | 52 | 9 | ||||
| Dec | 53 | 32 | ||||
| Jan | 104 | 61 | 50 | 42 | ||
| Feb | 57 | 89 | 96 | 38 | 56 | 26 |
| Mar | 77 | 95 | 106 | 131 | 46 | 82 |
| Apr | 51 | 79 | 142 | 60 | 109 | 42 |
| May | 13 | 26 | 142 | 48 | 108 | 19 |
| Jun | 0.7 | 3 | 3.6 | |||
NOAA/NWS Cooperative Observer Network Stations
| COUNTY | COOP STN NAME | COOP St ID | Div | NWS | LAT | LONG | ELEV |
|---|---|---|---|---|---|---|---|
| El Dorado | Blodgett Exp Forest | 40883 | 2 | BLEC1 | 38 54 43 | -120 39 53 | 4414 |
| El Dorado | Echo Summit Sierra Ski | 42671 | 3 | 38 47 | -120 02 | 7350 | |
| El Dorado | Georgetown 4 ENE | 43385 | N | 38 55 00 | -120 46 00 | 3251 | |
| El Dorado | Georgetown R S | 43384 | 2 | GEOC1 | 38 55 59 | -120 48 03 | 3001 |
| El Dorado | Kelsey 1 N | 44484 | 2 | Klsc1 | 38 48 32 | -120 49 15 | 2000 |
| El Dorado | Myers Inspection Stn | 45572 | 3 | xx | 38 51 | -120 01 | 6350 |
| El Dorado | Pacific House | 46597 | 2 | Pchc1 | 38 45 29 | -120 30 12 | 3440 |
| El Dorado | Placerville | 46960 | 2 | Plcc1 | 38 41 43 | -120 49 26 | 1850 |
| El Dorado | Placerville Disp Plant | 46964 | 2 | Pldc1 | 38 43 52 | -120 50 46 | 1560 |
| El Dorado | Robbs Peak P H | 47489 | 2 | Polc1 | 38 54 07 | -120 22 36 | 5120 |
| El Dorado | Tahoe Valley Faa Ap | 48762 | 3 | TVL KTVL | 38 54 00 | -120 00 00 | 6254 |
| Nevada | Boca | 40931 | 3 | Bocc1 | 39 23 00 | -120 06 00 | 5575 |
| Nevada | Bowman Dam | 41018 | 2 | Bodc1 | 39 27 00 | -120 39 00 | 5383 |
| Nevada | Donner Memorial St Pk | 42467 | 3 | Donc1 | 39 19 00 | -120 14 00 | 5937 |
| Nevada | Farad | 42972 | 3 | Farc1 | 39 26 00 | -120 02 00 | 5153 |
| Nevada | Grass Valley No 2 | 43573 | 2 | Grac1 | 39 12 15 | -121 04 05 | 2400 |
| Nevada | Harry Englebright Dam | 43800 | 2 | Hlec1 | 39 14 14 | -121 16 00 | 800 |
| Nevada | Lake Spaulding | 44713 | 2 | Lspc1 | 39 19 00 | -120 38 00 | 5155 |
| Nevada | Nevada City | 46136 | 2 | Nvdc1 | 39 14 53 | -121 00 06 | 2781 |
| Nevada | Sagehen Creek | 47641 | 3 | Sghc1 | 39 26 00 | -120 14 00 | 6337 |
| Nevada | Snow Laboratory Central | 48320 | 2 | CSSL | 39 20 | -120 22 | 6910 |
| Nevada | Soda Springs 1 E | 48332 | 2 | SODC1 | 39 19 00 | -120 22 00 | 6883 |
| Nevada | Truckee Rs | 49043 | 3 | Tkec1 | 39 20 00 | -120 11 00 | 6020 |
| Placer | Alpine Meadows | 40140 | 3 | APMC1 | 39 10 00 | -120 14 00 | 6960 |
| Placer | Auburn | 40383 | 2 | Aubc1 | 38 54 26 | -121 05 02 | 1292 |
| Placer | Blue Canyon | 40897 | 2 | BLU KBLU | 39 17 00 | -120 42 00 | 5280 |
| Placer | Colfax | 41912 | 2 | Cofc1 | 39 07 18 | -120 57 02 | 2400 |
| Placer | Foresthill Ranger Stn | 43134 | 2 | Fstc1 | 39 00 35 | -120 50 42 | 3015 |
| Placer | Gold Run 2 Sw | 43491 | 2 | Glrc1 | 39 09 12 | -120 51 29 | 3320 |
| Placer | Hell Hole | 43891 | 2 | Helc1 | 39 03 30 | -120 24 54 | 4850 |
| Placer | Iowa Hill | 44288 | 2 | Iowc1 | 39 07 05 | -120 50 06 | 3100 |
| Placer | Tahoe City | 48758 | 3 | TAHC1 | 39 10 00 | -120 08 00 | 6230 |
| Placer | Squaw Valley Lodge | 48474 | 3 | xx | 39 12 | -120 14 | 6230 |
| Sierra | Downieville | 42500 | 2 | Dwnc1 | 39 34 00 | -120 50 00 | 2914 |
| Sierra | Sierra City | 48207 | 2 | Siec1 | 39 34 04 | -120 37 22 | 4240 |
| Sierra | Sierraville R S | 48218 | 2 | Serc1 | 39 35 00 | -120 22 00 | 4975 |
| Amador | Fiddletown Dexter Ranch | 43038 | 5 | Fddc1 | 38 31 25 | -120 42 22 | 2160 |
| Amador | Salt Springs Pwr House | 47689 | 5 | Spgc1 | 38 30 02 | -120 13 08 | 3700 |
| Amador | Tiger Creek Ph | 48928 | 5 | Tigc1 | 38 26 46 | -120 29 57 | 2355 |
| Douglas, NV | Stateline-Harrash's | 27806 | x | xx | 38 58 | -119 57 | 6250 |
| Washoe, NV | Mount Rose Highway STN | 26554 | x | xx | 39 20 | -119 53 | 7370 |
Stations with Snow Depth or Snowfall information
California Data Exchange Center (CDEC) Station ID
Tahoe: (Map) BWY - BROCKWAY SUMMIT DMN - DIAMOND CROSSING LCR - LOST CORNER MOUNTAIN RP2 - RUBICON PEAK 2 RP3 - RUBICON PEAK 3 SQ1 - SQUAW VALLEY 1 SQV - SQUAW VALLEY GOLD COAST TCC - TAHOE CITY CROSS Current TCT - TAHOE CITY 1910-1977 WC3 - WARD CREEK 3 daily 2004-present |
Donner (Map) CC5 - CASTLE CREEK 5 CCO - CISCO CSF - CISCO FLAT DMS - DONNER MEM ST PARK DNR - DONNER LAKE (SNOW COURSE) DNS - DONNER SUMMIT DP2 - DONNER PARK 2 SDS - SODA SPRINGS TK2 - TRUCKEE 2 |
| Month | Oct | Nov | Dec | Jan | Feb | Mar | Apr | May | Jun | Jul | Aug | Sep |
| Avg. snowfall (in.) | 3 | 17 | 34 | 44 | 37 | 36 | 15 | 4 | 0 | 0 | 0 | 0 |
| Avg. snow depth | 0 | 3 | 11 | 21 | 30 | 28 | 14 | 2 | T | 0 | 0 | T |
Greatest Sierra snowstorms (1949-50 through 2004-2005) with storm total snowfall amounts (in.) At various locations
Can - canyon dam (plumas county)
boc - Boca (nevada county)
css - central Sierra snow lab (nevada-Placer county)
tah - Tahoe City (placer county)
grg - Grant Grove (tulare county)
                                     can    boc    css    tah    grg
   1.  Jan. 10-17, 1952             108.0   68.0  141.0  149.0   68.0
   2.  Mar. 28-Apr. 1, 1982          26.0   47.0  125.5   59.0   63.0
   3.  Mar. 29-Apr. 4, 1958          46.5   48.0    mm    98.5   69.0
   4.  Dec. 28, 1992-Jan. 2, 1993    74.0   47.0   76.6   57.5    mm
   5.  Mar. 21-24, 1995              32.0   26.0  100.6   74.0   59.0

   6.  Mar. 10-14, 1967              60.0   59.0   74.8   92.0   38.5
   7.  Jan. 31-Feb. 4, 1975          62.0   38.0   65.0   42.0   25.0
   8.  Dec. 27-31, 1964              46.0   42.0   87.2   77.0   26.0
   9.  Feb. 23-26, 1969              35.0   28.0   74.0   37.0   63.0
  10.  Jan. 27-30, 1981              24.0   24.0   72.0   40.0   48.0

  11.  Dec. 21-23, 1996              23.0   65.0   53.6   73.0   25.0
  12.  Dec. 29, 2004-Jan. 2, 2005    48.0   49.5   89.7   64.0    mm
  13.  Feb. 9-12, 1959               43.0   31.0    mm    43.0   64.0
  14.  Feb. 16-18, 1990              30.0   49.0   73.0   46.0   24.0
  15.  Jan. 20-23, 1997              34.0   18.0   73.4   44.0   35.0

Mm - missing data
Range at CSS 4'-6 (54) to 11'-9 (141)
--
Source: Public Information Statement, TUE JAN 01 2008,
from the National Weather Service  Reno Weather Forecast Office.

Links:
2023	60		1999	39
2011	54		2006	36
1995	50		2003	33
2017	48		2022	33
1998	44		2020	32
2010	42		2002	32
1993	42		2016	31
2019	41		2004	31
2005	40		2009	30

Warings and Alerts at the Emergency Info. page
Historical data from Informative Ski Reports and Other Ski Links by Tony Crocker
See Snow Load for potential roof damage.