Reference
Demographics
World Population
Reference
Demographics
World Population
| Don's Home
Reference
Demographics
World Population
| Contact |
Under Construction  World Population | Largest Countries | growth by country | By Region | By Age Population (Millions)
|
|
See Population by Region in Places
Source: World Population Since Creation by Lambert Dolphin | and Historical Estimates of World Population from the Census Bureau. E.A. Wrigley and R.S. Schofield, (Eds.). The Population History of England, Cambridge Univ. Press, 1989
(1) Curde Birth/Death rates - Number of births/deaths over a given period divided by the person-years lived by the population over that period. It is expressed as number of births per 1,000 population. (2) Developing countries: Less developed countries include all countries in Africa, Asia (excluding Japan), and Latin America and the Caribbean, and the regions of Melanesia, Micronesia, and Polynesia. Note: The fact that death rates increase in 2050 does not mean people are dying younger. It is a consequence of the birth rate going down resulting in a larger portion of the population in the older age groups. China first implemented the "one child" rule--perhaps the best-known population policy in the world--in the 1970s amidst growing concerns over whether the famine-prone country could continue to feed its skyrocketing population. The rule, which reportedly is more lax today, stipulates that urban couples should have only one child. Couples in rural areas, where 80 percent of the population lives, may have two or possibly more children but should delay getting married initially and then space their children. | ||||||||||||||||||||||||||||||||||||||||||||||||||||||||||||||||||||||||||||||||||||||||||||||||||||||
|
In some cases the Crude Birth Rate (CBR) is slightly higher than the Crude Death Rate (CDR) (as in the U.S. 14 versus 9) while in other countries the CBR is less than the CDR (as in Germany, 9 versus 10). The world is moving toward population stabalization (zero growth) faster than thought 10 years ago because of falling birth rates and rising death rates in some areas. The original UN estimate showed stabalization (zero growth) just after 2200 with a world population of 11 B. The 1998 medium variant estimate shows a rate which will stabalize at just over 9 B around 2060. (Based on UN World Population Prospects medium variant projections) Recent data shows that fertility (average number of children per woman is dropping faster than expected in developing countries. This has been attributed to better education and women having more choice rather than government policy. Infant mortality rates are dropping eliminating one reason for larger families. For example Brazil's fertility rate in 2001 was about 2.2 down from 6.2 in the last half of the last century. The zero growth rate is 2.1 Lester Brown, Gary Gardner and Brian Halweil of the Worldwatch Institute have identified three specific threats that either are already pushing death rates up or that have the potential to do so - the HIV epidemic, aquifer depletion, and shrinking cropland area per person. The World Bank Development Education Program (DEP) site shows the difference between birth and death rates for developed and developing countries. Thay say: "Around the world, death rates gradually decreased in the late 19th and the 20th centuries, with death rates in the developing world plummeting after World War II thanks to the spread of modern medicine. In much of the developing world the decline in death rates preceded the decline in birth rates by 20 years or more, resulting in record-high rates of population growth of 3 percent or even 4 percent a year. Since the 1960s birth rates have also been declining rapidly in most developing countries except those in Sub-Saharan Africa and the Middle East. This trend in birth rates in the developing world is comparable to what took place in Europe and the United States in the 19th century." 
Reverend Thomas Malthus published An Essay on the Principle of Population in 1798 which argued that population would increase faster than food production and the population will be checked by famines, epidemics or wars. See Malthus.
See Also: Human Population Growth, by John W. Kimball,
Human Population: Fundamentals of Growth Three Patterns of Population Change at the Population Reference Bureau Countries with Highest Projected Population in 20501,000's (Based on UN World Population Prospects medium variant projections in 2002) | |||||||||||||||||||||||||||||||||||||||||||||||||||||||||||||||||||||||||||||||||||||||||||||||||||||||||||||||||||||||||||||||||||||||||||||||||||||||||||||||||||||||||||||||||||||||||||||||||||||||||||||||||||||||||||||||||||||||||||||||||||||||||||||||||||||
|
| ||||||||||||||||||||||||||||||||||||||||||||||||||||||||||||||||||||||||||||||||||||||||||||||||||||||||||||||||||||||||||||||||||||||||||||||||||||||||||||||||||||||||||||||||||||||||||||||||||||||||||||||||||||||||||||||||||||||||||||||||||||||||||||||||||||
|
Red entries indicate population which is decreasing
from 1998 to 2050 Source: www9.ocn.ne.jp/~aslan/pfe/pop.htm Top 10 contributers to population growth from 2000-2050 (1,000's) (2006 estimate)
* TFR Total Fertility Rate (Average number of babies born to women during their reproductive years) in 2005 (siakhenn.tripod.com/fertility.html)
World Population Growth
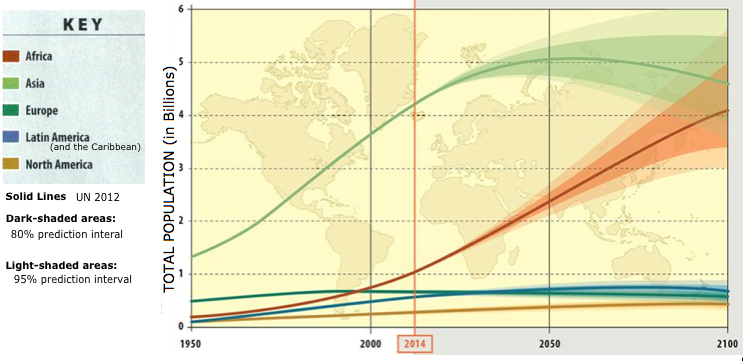
The United Nations (UN) recently released population projections based on data until 2012 and a Bayesian probabilistic methodology. Analysis of these data reveals that, contrary to previous literature, the world population is unlikely to stop growing this century. There is an 80% probability that world population, now 7.2 billion people, will increase to between 9.6 billion and 12.3 billion in 2100. This uncertainty is much smaller than the range from the traditional UN high and low variants. Much of the increase is expected to happen in Africa, in part due to higher fertility rates and a recent slowdown in the pace of fertility decline. Also, the ratio of working-age people to older people is likely to decline substantially in all countries, even those that currently have young populations. Life Expectancy Sample: Japan 84.5; Switzerland 82.4; Italy 82.0; France 81.7; Canada 81.7; UK 80.4; Germany 80.4; EU 80.0; US 79.6; Chile 78.4; Cuba 78.2. More
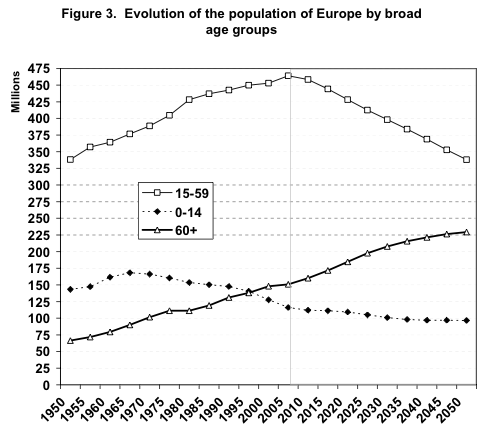
Europe's LE is now lower than North America's because of a rise in mortality in Eastern Europe after the break-up of the Soviet Union.
Oldest People
See: Deaths (Cause, Rate by Age, Life Expectancy) Return to Reference | |||||||||||||||||||||||||||||||||||||||||||||||||||||||||||||||||||||||||||||||||||||||||||||||||||||||||||||||||||||||||||||||||||||||||||||||||||||||||||||||||||||||||||||||||||||||||||||||||||||||||||||||||||||||||||||||||||||||||||||||||||||||||||||||||||||