New Data
American Ethnic Groups 2020 Census | Wikipedia
Region 2015 or 2020 ?
| European American | 57.8% |
| Hispanic and Latino American | 18.7% |
| Black and African American Ancestry | 12.1% |
| Asian American | 5.9% |
| Multiracial | 4.1% |
| Middle Eastern American | 3.2% |
| Native American | 1.8% |
By country
Population by ancestry group
2015 Results
Ancestry of U.S. Population by Rank | InfoPlease
| Rank | Ancestry Group | Population | % |
| 1 | German | 46,403,053 | 14.5% |
| 2 | Black/African-American1(non-Hispanic)1 | 38,785,726 | 12.1% |
| 3 | Mexican(of any race) | 34,640,287 | 10.8% |
| 4 | Irish | 33,526,444 | 10.5% |
| 5 | English | 24,787,018 | 7.7% |
| 6 | American1 | 22,746,991 | 7.1% |
| 7 | Italian | 17,285,619 | 5.4% |
| 8 | Polish | 9,385,766 | 2.9% |
| 9 | French | 8,272,538 | 2.6% |
| 10 | Scottish | 5,409,343 | 1.7% |
| 11 | Puerto Rican | 5,174,554 | 1.6% |
| 12 | Norwegian | 4,445,030 | 1.4% |
| 13 | Dutch | 4,289,116 | 1.3% |
| 14 | Swedish | 3,933,024 | 1.2% |
| 15 | Chinese | 3,852,099 | 1.2% |
| 16 | Asian Indian | 3,303,512 | 1.0% |
| 17 | Scotch-Irish | 3,046,005 | 0.9% |
| 18 | Russian | 2,843,400 | 0.9% |
| 19 | West Indian(non-Hispanic) | 2,824,722 | 0.9% |
| 20 | Filipino | 2,717,844 | 0.8% |
1. Group may encompass several ancestries not listed separately
last updated 16 May 2009
Population and Growth | Sources of Growth | Immigration (Illegal) | Ethnic Mix | Age | Marital Status
New York-Newark-Bridgeport, NY-NJ-CT-PA Combined Statistical Areas (CSA)
|
|
| Stat | 1990 | 2000 | 2001 | 2002 | 2003 | 2004 |
|
Census Bureau Data a/o Mar. 2004 |
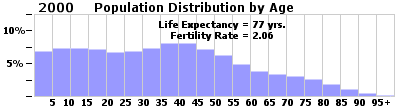
| Fertility Rate:1 | 2.08 | 2.06 | 2.03 | 2.01 | | |
| Crude Birth Rate:2 | 16.7 | 14.4 | 14.1 | 13.9 | | |
| Crude Death Rate: | 9.4 | 8.7 | 8.5 | | | |
CIA World Factbook historical data reported at:
indexMundi
(Rates = Num. per 1,000) |
| Fertility Rate: | | 2.06 | 2.06 | 2.07 | 2.07 | 2.07 |
| Crude Birth Rate: | | 14.2 | 14.2 | 14.1 | 14.14 | 14.13 |
| Crude Death Rate: | | 8.7 | 8.7 | 8.7 | 8.44 | 8.34 |
| Net Gain (Birth-Deaths) | | 5.5 | 5.5 | 5.4 | 5.7 | 5.79 |
| Immigration Rate (Legal) | | 3.5 | 3.5 | 3.5 | 3.53 | 3.41 |
| (Illegal - net gain) | | 1.9 | 1.9 | 1.9 | 1.9 | 1.9 |
| Pop Growth % | | 0.91 | 0.9% | 0.89% | 0.92% | 0.92% |
| Life expectancy: | 76.2 | 77.12 | 77.26 | 77.4 | 77.14 | 77.43 |
1. Total Fertility Rate (TFR) - Average number of babies born to women during their reproductive years. A TFR of 2.1 is considered the replacement rate.
2. Birth/Death Rates = Num. per 1,000 total population
U.S. fertility is dramatically higher than almost all other developed countries. Europe's aggregate fertility varies between approximately 1.3 and 1.5, depending upon region, and Japan is at 1.3.
Source: Population Reference Bureau.
Historically, fertility rates in the United States have fluctuated widely. The total fertility rate decreased from 3.3 children per woman after World War I to 2.1 during the Great Depression, rose to 3.7 in 1957, and then fell to 1.7 in 1976. After 1976, the total fertility rate began to rise again, reaching a level of 2.07 for 1991. Since then, the total fertility rate has remained fairly stable.
Fertility of foreign born women was about 30% higher than native born.
Women born in Latin America had a 50% higher fertility rate.
Source: Population Profile at census.gov, 1998.
(Note: although the fertility rate dropped below the zero growth level of 2.1
in 1972 the population will continue to grow for 3 more generations because of
population momentum, a relatively high concentration of people in their
childbearing years.
Teen Birth Rate:
1990 - 53, 2000 - 47.7, 2002 - 43.0
*Teen births per 1,000 females age 15-19
See: Birth/Death Rates at the World Population Page.
Sources:
Census Bureau: Population Analysis Spreadsheets (PAS)
Californians for Population Stabilization CAPS
SUSPS
 CDC National Center for Health Statistics
indexMundi
CIA World Factbook
Population and Vital Statistics at the Census Bureau
Immigration:
Two amnesty programs provided legal status to nearly 3 million undocumented immigrants and their families in the late '80s and early '90s.
Source: newsbatch.com/immtotal.html
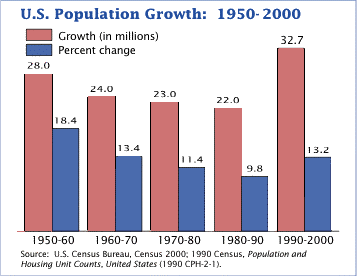
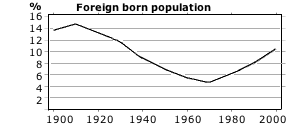
During the 1990s, the U.S. immigrant population experienced its largest increase ever--about 11.3 million people (0.4%/yr.). As a result, the foreign-born share of the population jumped from 7.9 percent in 1990 to 11.1 percent (31 Million) in 2000. Yet Census Bureau estimates at the beginning of the new century indicate that the enormous increase of the 1990s will pale by comparison to the increase that will take place by the time we reach 2010. If immigration continues at its current rate for the rest of the decade, the immigrant population will have increased by another 14 million, reaching a total of 45 million residents, and it will constitute 14.2 percent of the population.
Region of Birth:
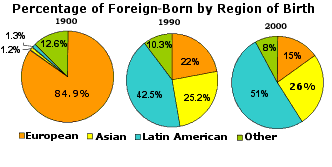 
Source: U.S.English Foundation (www.us-english.org/foundation/research/amimmigr/)
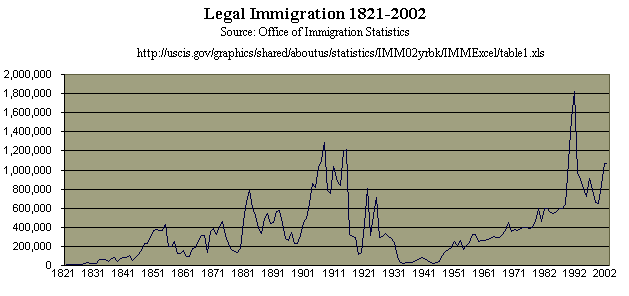
1851 and 1860, 2,639,752 souls sought a new life in America (1.3% of population/yr.). Most were still of European origin, but many Chinese came to the West Coast during the gold rush period. Most settled in the San Francisco area. The two nationalities coming to the United States in the largest numbers continued to be the Irish and the Germans. kclibrary.nhmccd.edu/19thcentury1850.htm
Illegal Immigration
In Feb. 2003 the US Citizenship and Immigration Services (USCIS) of the Department of Homeland Security (Formerly Immigration and Naturalization Service (INS)) released the first official government figures on illegal immigration since 1996. The figures show that between October 1996 and January 2000, the number of illegal immigrants grew from about 5.8 million to about 7 million, an increase of more than 350,000 annually. (See 2009 update from Pew Research below).
About 850,000 illegals have entered each year since 2000.
An INS estimate for 1999 was:
968,000 new immigrants settled in the US
210,000 Died or returned home on their own.
63,000 Removed by the INS
183,000 Given Green cards
512,000 Net gain
Where they come from (2003 study):
78% Latin America
13% Asia
6% Canada/Europe
3% Africa/other
A 2009 Pew study estimated that 11.9 million illegal immigrants lived in the U.S. Of those, 8.3 million were in the labor force as of March 2008, making up 5.4 percent of the U.S. work force.
In 2008, California had the most illegal immigrants at 2.7 million, double its 1990 number, followed by Texas, Florida, New York and New Jersey. Still, California's 22 percent share of the nation's illegal immigrant population was a marked drop-off from its 42 percent share in 1990.
The majority came from Mexico (59 percent), numbering 7 million. Other regions included Asia (11 percent), Central America (11 percent), South America (7 percent), the Caribbean (4 percent) and the Middle East (2 percent).
The largest group is young families. About 47 percent of illegal immigrant households have children, compared with 21 percent for U.S.-born residents and 35 percent for legal immigrants.
Roughly three out of four of their children -- or 4 million -- were born in the U.S. In 2003, 2.7 million children of illegal immigrants, or 63 percent, were born in this country. About 1 out of 4 youth in the U.S. are immigrants or children of immigrants.
Because the Census Bureau does not ask people about their immigration status, the estimate on illegal immigrants is derived largely by subtracting the estimated legal immigrant population from the total foreign-born population.
An Article at chattheplanet.com states: 5,000 foreigners make unauthorized entries each day. 4,000 of them are apprehended just after they cross the U.S.-Mexico border.
1,000 become illegal immigrants.
The numbers above (900,000 per year) equates to about 2,500 per day who stay.
See:
Population Reference Bureau
Unauthorized Immigrant Population: National and State Trends, 2010 | Pew Hispanic Center
The Migration Policy Institute Oct. 2003
FAIR - Federation for American Immigration Reform - (Illegal)
U. S. Citizenship and Immigration Services (USCIS) of the Department of Homeland Security.
Center for Immigration Studies
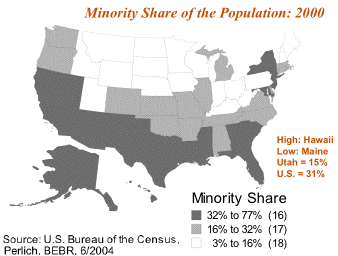
Minority (non-white) population
From: www.census.gov/prod/2001pubs/c2kbr01-1.pdf
For the 2000 census the Census Bureau considers race to be separate from Hispanic or Latino origin. They also allowed people to list combinations (2 or more) of races.
2000 Census
| Race | Number | non-Hisp | Hisp | Total |
| One race | Percent |
| White | 211,460,626 | 69.1 | 6.0 | 75.1 |
| Black or African American | 34,658,190 | 12.1 | 0.3 | 12.3 |
| American Indian and Alaska Native | 2,475,956 | 0.7 | 0.1 | 0.9 |
| Asian | 10,242,998 | 3.6 | - | 3.6 |
| Native Hawaiian and Other Pacific | 398,835 | 0.1 | - | 0.1 |
| Some other race | 15,359,073 | 0.2 | 5.3 | 5.5 |
| Two or more races | 6,826,228 | 1.6 | 0.8 | 2.4 |
| Total | 281,421,906 | 87.5 | 12.5 | 100 |
48% of
Hispanics reported only White,
while approximately 42% reported only Some other race.
See Overview of Race and Hispanic Origin at NationalAtlas.gov
| Category | 2000 | 2050 |
| Calif. | US | US |
| White (non-hispanic) | 46.7% | 69.1% | 50.1% |
| Hispanic | 32.4% | 12.5% | 24.4% |
| Black or African American | 6.7% | 12.3% | 14.6% |
| Asian | 10.9% | 3.6% |
8% |
| American Indian and Alaska Native | 1.0% | 0.9% | |
The Census Bureau Projects Tripling of Hispanic and
Asian Populations in 50 Years; Non-Hispanic Whites
May Drop To Half of Total Population.
See: Immigrants in Calif.
Largest Ethnic Groups in the United States
Ancestry: 2000 - Ethnic Groups in the United States | www.census.gov
Most common two or more race combinations (Hispanic not counted as a race in 2000):
| Combination | Number | % of total pop. |
| White; Some other race | 2,206,251 | 0.8% |
| White; American Indian and Alaska Native | 1,082,683 | 0.4% |
| White; Asian | 868,395 | 0.3% |
| White; Black or African American | 784,764 | 0.3% |
| Black or African American; Some other race | 417,249 | 0.1% |
| American Indian; Hispanic | 281,422 | 0.1% |
| Asian; Some other race | 249,108 | 0.09% |
| Black or African American; American Indian and Alaska Native | 182,494 | 0.06% |
| Asian; Native Hawaiian and Other Pacific Islander | 138,802 | 0.05% |
Whites in combination with other races (2000)
| Number | Percent |
| White alone | 211,460,626 | 75.1 |
| White; American Indian and Alaska Native | 1,082,683 | 0.4 |
| White; Asian | 868,395 | 0.3 |
| White: Black or African American | 784,764 | 0.3 |
| White; Native Hawaiian and Other Pacific Islander | 112,964 | - |
| All other combinations including White | 2,621,543 | 0.9 |
| All white incl. combinations | 216,930,975 | 77.1 |
Note: In certain fields in biology race is used as a synonym for subspecies or, in botany, variety. Race in humans is increasingly regarded as a social construct rather than a biological distinction.
Where they live:
Growth Rates 2007-2008
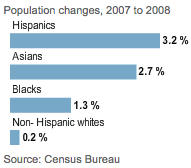 2/3 of hispanic growth was from births rather than immigration. This is due to
a younger hispanic population and higher birth rate. Median age for non-hispanic whites is 41 yrs., for hispanics it is 28 yrs.
2/3 of hispanic growth was from births rather than immigration. This is due to
a younger hispanic population and higher birth rate. Median age for non-hispanic whites is 41 yrs., for hispanics it is 28 yrs.
43% of the under 20 population is minority.
|
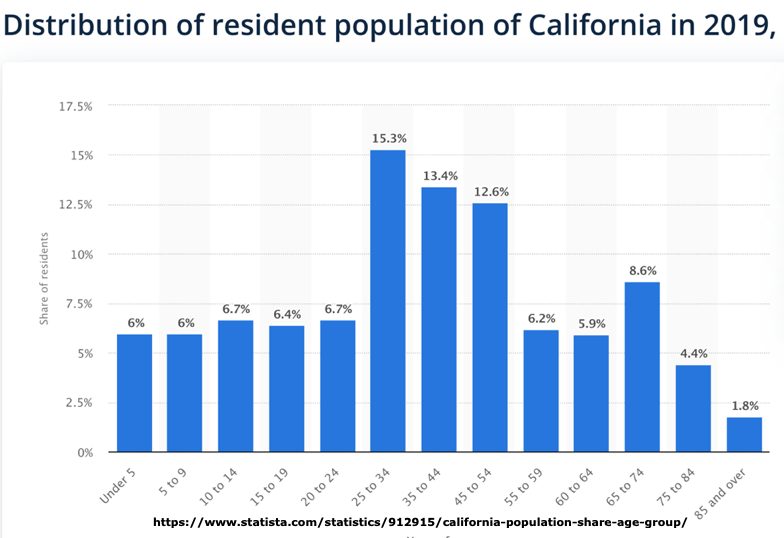
By Age
| | 1990 | 2000 | Change 1990-2000 |
| Age | Num | % | Num | % | Number | Percent |
| total | 248,709,873 | 100.0% | 281,421,906 | 100.0% | 32,712,033 | 13.2% |
| Under 5 | 18,354,443 | 7.4% | 19,175,798 | 6.8% | 821,355 | 4.5% |
| 5 to 9 | 18,099,179 | 7.3% | 20,549,505 | 7.3% | 2,450,326 | 13.5% |
| 10 to 14 | 17,114,249 | 6.9% | 20,528,072 | 7.3% | 3,413,823 | 19.9% |
| 15 to 19 | 17,754,015 | 7.1% | 20,219,890 | 7.2% | 2,465,875 | 13.9% |
| 20 to 24 | 19,020,312 | 7.6% | 18,964,001 | 6.7% | -56,311 | -0.3% |
| 25 to 29 | 21,313,045 | 8.6% | 19,381,336 | 6.9% | -1,931,709 | -9.1% |
| 30 to 34 | 21,862,887 | 8.8% | 20,510,388 | 7.3% | -1,352,499 | -6.2% |
| 35 to 39 | 19,963,117 | 8.0% | 22,706,664 | 8.1% | 2,743,547 | 13.7% |
| 40 to 44 | 17,615,786 | 7.1% | 22,441,863 | 8.0% | 4,826,077 | 27.4% |
| 45 to 49 | 13,872,573 | 5.6% | 20,092,404 | 7.1% | 6,219,831 | 44.8% |
| 50 to 54 | 11,350,513 | 4.6% | 17,585,548 | 6.2% | 6,235,035 | 54.9% |
| 55 to 59 | 10,531,756 | 4.2% | 13,469,237 | 4.8% | 2,937,481 | 27.9% |
| 60 to 64 | 10,616,167 | 4.3% | 10,805,447 | 3.8% | 189,280 | 1.8% |
| 65 to 69 | 10,111,735 | 4.1% | 9,533,545 | 3.4% | -578,190 | -5.7% |
| 70 to 74 | 7,994,823 | 3.2% | 8,857,441 | 3.1% | 862,618 | 10.8% |
| 75 to 79 | 6,121,369 | 2.5% | 7,415,813 | 2.6% | 1,294,444 | 21.1% |
| 80 to 84 | 3,933,739 | 1.6% | 4,945,367 | 1.8% | 1,011,628 | 25.7% |
| 85 to 89 | 2,060,247 | 0.8% | 2,789,818 | 1.0% | 729,571 | 35.4% |
| 90 to 94 | 769,481 | 0.3% | 1,112,531 | 0.4% | 343,050 | 44.6% |
| 95 and over | 250,437 | 0.1% | 337,238 | 0.1% | 86,801 | 3.5% |
See Also: Age distribution profile at Nationmaster.com
The Aging of the US Population and Its Impact on Computer Use
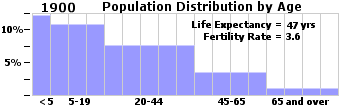
Life Expectancy 1900 - 2000 at the CDC and Death Rate here.
As a result of aging baby boomers, the U.S. population ages 65 and older will grow from 13 percent today to 18 percent by 2025, and the median age of the country will increase from 35.5 to 39 years of age. By 2050, more than one-fifth of all Americans are expected to be over the age of 65.
See: Population Resource Center and Social Security Admin.
Marital Status of Persons 15 Years and Over (1998)
| Males | Females | All |
| Total | 95,009 | 102,403 | 197,412 |
| Married, spouse present | 58% | 54% | 56% |
| Never married | 27% | 21% | 24% |
| Currently Divorced | 9% | 11% | 10% |
| Widowed not remarried | 3% | 11% | 7% |
| Separated | 3% | 4% | 4% |
| Ever divoced | 20.4% | 22.2% | |
Source: "Marital Status and Living Arrangements" - (Data Tables), Census Bureau 1998
Marriage/Divorce Rates here
Marriage Stats at unmarried.org
See Also:
- Population by state
- Ethnicity by state
- Distribution by y Age, Race, Nativity, and Sex Ratio at infoPlease.com
- Fertility rates and marriages by race
- Reader's Companion to American History - Fertility and Mortality in the United States, 1800-1980
- Marriage/Divorce Rates
- State Growth Rates (Excel), US Census, Projections to 2100 , Immigration
- Population by County
- Highest income counties
- US state/city stats (population, income, zip codes, area codes, ...)
- Deaths (Cause, Rate by Age, Life Expectancy)
- Stats at MapStats
- Executive Summary: A Population Perspective of the United States at the Population Resource Center.
- 1950-Present at nemw.org
- Population Projections for States by Age, Sex, Race,
and Hispanic Origin: 1995 to 2025
- Population Aging at longevity-science.org
See Also:
Census Bureau Regions
California stats.
Return to Reference
|
 Reference