Under Construction 
The president is elected by votes from the electoral college where there are 538 votes.
Votes are based 435 congressional districts (apportioned to states based on population) plus 100 Senators (2 per state) plus 3 votes for DC. You need 270 votes to win.
Most states have a winner take all electoral vote system. Maine and Nebraska, use a tiered system where a single elector is chosen within each Congressional district and two electors are chosen by statewide popular vote.
See Electoral College (United States) - Wikipedia
This system allows a candidate to loose the popular vote (As George W. Bush did in 2000 (Bush - 50,456,002 votes, Gore - 50,999,897 votes), but win the election.
The other seeming inequity in the system is if you are in a state that strongly supports one party or the other, your vote doesn't matter because the state is always going to going to cast all their electoral votes for the winner.
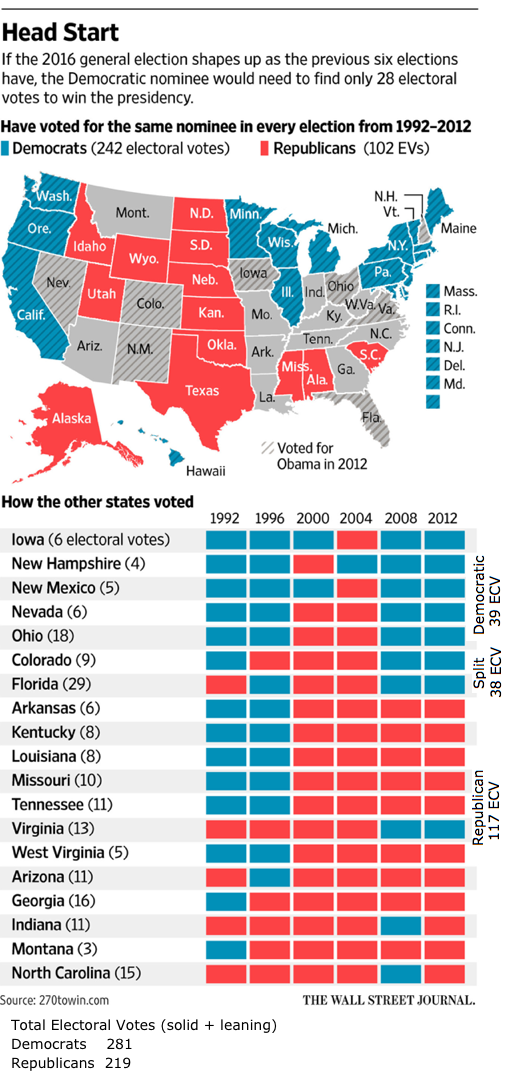
This is true for the following in 1992-2012;
Republican States: Alabama, Alaska, Idaho, Kansas, Mississippi, Nebraska, North Dakota, Oklahoma, South Carolina, South Dakota, Texas, Utah, Wyoming.
and
Democratic States: California, Connecticut, Delaware, D.C., Hawaii , Illinois, Maine, Maryland, Massachusetts, New Jersey, New York, Michigan, Minnesota, Oregon, Pennsylvania, Vermont, Washington, Wisconsin.
Arkansas and Tennessee had the native son effect with Clinton and Gore in '92 and '96, or they would have been on this list.
The exceptions are Reagan's popularity in the 1980's and Roosevelt's popularity in the 30's.
The 1960's marked a shift in political ideologies.
Southern conservatives where Democrats because they didn't want to belong to the party of Lincoln after the slavery issue in the Civil war. They decided it was OK to be Republican after Barry Goldwater, who had voted against the Civil Rights act became the Republican candidate in 1964.
Another thing pushing southern conservatives was voter registration efforts in the 60's, which brought more African Americans into the Democratic party.
These two issues accelerated the transition from a solid South for the Democrats to one for the Republicans.
In 1967 George Wallace ran for the American Independent party and got 13.5% of the vote.
Swing States and Safe States:
Safe states - republican: 17 states - 138 Electoral College Votes (ECV)
Safe states - democratic: 15 states - 186 ECV
Swing states: 19 states - 214 ECV (States which have been swing states in at least one of the last 5 elections)
FiveThirtyEight lists 7 swing states for 2016, Wikipedia and Politico listed 11 states for 2012 (but 2 are different), CNN listed 7 battleground states for 2008, The Wall Street Journal listed 16 battleground states for 2000.
| Candidates |  | ![]()  |  |  |  |  |  |  |  |  |  |  |  |  |  |  |  |  |
Safe states and swing states |
| State | 1948 | 1952 | 1956 | 1960 | 1964 | 1968 | 1972 | 1976 | 1980 | 1984 | 1988 | 1992 | 1996 | 2000 | 2004 | 2008 | 2012 | 2016 | State | ECV |
| Winner ECV * | 303 | 442 | 457 | 303 | 486 | 301 | 520 | 297 | 489 | 525 | 426 | 370 | 379 | 271 | 286 | 365 | 332 | 279 | Swing states
SS | |
| Winner Popular % | 49.6 | 54.9 | 57.4 | 49.7 | 61.1 | 43.4
1 | 60.2 | 50.0 | 50.5 | 58.8 | 53.4 | 43.0
1 | 49.2
1 | 47.9
1 | 50.7 | 52.9 | 51.1 | 47.2
1 |
| Alabama | SR | D | D | I | R | AI | R | D | R | R | R | R | R | R | R | R | R | | AL | 9 |
| Alaska | | | | R | D | R | R | R | R | R | R | R | R | R | R | R | R | | AK | 3 |
| Arizona | D | R | R | R | R | R | R | R | R | R | R | R | D | R | R | R | R | | AZ | 11 |
| Arkansas | D | D | D | D | D | AI | R | D | R | R | R | D2 | D2 | R | R | R | R | | AR | 6 |
| California | D | R | R | R | D | R | R | R | R | R | R | D | D | D | D | D | D | | CA | 55 |
| Colorado | D | R | R | R | D | R | R | R | R | R | R | D | R | R | R | D | D | | CO | 9 |
| Connecticut | R | R | R | D | D | D | R | R | R | R | R | D | D | D | D | D | D | | CT | 7 |
| Delaware | R | R | R | D | D | R | R | D | R | R | R | D | D | D | D | D | D | | DE | 3 |
| D.C. | | | | | D | D | D | D | D | D | D | D | D | D | D | D | D | | DC | 3 |
| Florida | D | R | R | R | D | R | R | D | R | R | R | R | D | R | R | D | D | | FL | 29 |
| Georgia | D | D | D | D | R | AI | R | D | D | R | R | D | R | R | R | R | R | | GA | 16 |
| Hawaii | | | | D | D | D | R | D | D | R | D | D | D | D | D | D | D | | HI | 4 |
| Idaho | D | R | R | R | D | R | R | R | R | R | R | R | R | R | R | R | R | | ID | 4 |
| Illinois | D | R | R | D | D | R | R | R | R | R | R | D | D | D | D | D | D | | IL | 20 |
| Indiana | R | R | R | R | D | R | R | R | R | R | R | R | R | R | R | D | R | | IN | 11 |
| Iowa | D | R | R | R | D | R | R | R | R | R | D | D | D | D | R | D | D | | IA | 6 |
| Kansas | R | R | R | R | D | R | R | R | R | R | R | R | R | R | R | R | R | | KS | 6 |
| Kentucky | D | D | R | R | D | R | R | D | R | R | R | D | D | R | R | R | R | | KY | 8 |
| Louisiana | SR | D | R | D | R | AI | R | D | R | R | R | D | D | R | R | R | R | | LA | 8 |
| Maine | R | R | R | R | D | D | R | R | R | R | R | D | D | D | D | D | D | | ME | 4 |
| Maryland | R | R | R | D | D | D | R | D | D | R | R | D | D | D | D | D | D | | MD | 10 |
| Massachusetts | D | R | R | D | D | D | D | D | R | R | D | D | D | D | D | D | D | | MA | 11 |
| Michigan | R | R | R | D | D | D | R | R | R | R | R | D | D | D | D | D | D | | MI | 16 |
| Minnesota | D | R | R | D | D | D | R | D | D | D | D | D | D | D | D | D | D | | MN | 10 |
| Mississippi | SR | D | D | I | R | AI | R | D | R | R | R | R | R | R | R | R | R | | MS | 6 |
| State | 1948 | 1952 | 1956 | 1960 | 1964 | 1968 | 1972 | 1976 | 1980 | 1984 | 1988 | 1992 | 1996 | 2000 | 2004 | 2008 | 2012 | State | ECV |
| Missouri | D | R | D | D | D | R | R | D | R | R | R | D | D | R | R | R | R | | MO | 10 |
| Montana | D | R | R | R | D | R | R | R | R | R | R | D | R | R | R | R | R | | MT | 3 |
| Nebraska | R | R | R | R | D | R | R | R | R | R | R | R | R | R | R | R | R | | NE | 5 |
| Nevada | D | R | R | D | D | R | R | R | R | R | R | D | D | R | R | D | D | | NV | 6 |
| New Hampshire | R | R | R | R | D | R | R | R | R | R | R | D | D | R | D | D | D | | NH | 4 |
| New Jersey | R | R | R | D | D | R | R | R | R | R | R | D | D | D | D | D | D | | NJ | 14 |
| New Mexico | D | R | R | D | D | R | R | R | R | R | R | D | D | D | R | D | D | | NM | 5 |
| New York | R | R | R | D | D | D | R | D | R | R | D | D | D | D | D | D | D | | NY | 29 |
| North Carolina | D | D | D | D | D | R | R | D | R | R | R | R | R | R | R | D | R | | NC | 15 |
| North Dakota | R | R | R | R | D | R | R | R | R | R | R | R | R | R | R | R | R | | ND | 3 |
| Ohio | D | R | R | R | D | R | R | D | R | R | R | D | D | R | R | D | D | | OH | 18 |
| Oklahoma | D | R | R | R | D | R | R | R | R | R | R | R | R | R | R | R | R | | OK | 7 |
| Oregon | R | R | R | R | D | R | R | R | R | R | D | D | D | D | D | D | D | | OR | 7 |
| Pennsylvania | R | R | R | D | D | D | R | D | R | R | R | D | D | D | D | D | D | | PA | 20 |
| Rhode Island | D | R | R | D | D | D | R | D | D | R | D | D | D | D | D | D | D | | RI | 4 |
| South Carolina | SR | D | D | D | R | R | R | D | R | R | R | R | R | R | R | R | R | | SC | 9 |
| South Dakota | R | R | R | R | D | R | R | R | R | R | R | R | R | R | R | R | R | | SD | 3 |
| Tennessee | D | R | R | R | D | R | R | D | R | R | R | D2 | D2 | R | R | R | R | | TN | 11 |
| Texas | D | R | R | D | D | D | R | D | R | R | R | R | R | R | R | R | R | | TX | 38 |
| Utah | D | R | R | R | D | R | R | R | R | R | R | R | R | R | R | R | R | | UT | 6 |
| Vermont | R | R | R | R | D | R | R | R | R | R | R | D | D | D | D | D | D | | VT | 3 |
| Virginia | D | R | R | R | D | R | R | R | R | R | R | R | R | R | R | D | D | | VA | 13 |
| Washington | D | R | R | R | D | D | R | R | R | R | D | D | D | D | D | D | D | | WA | 12 |
| West Virginia | D | D | R | D | D | D | R | D | D | R | D | D | D | R | R | R | R | | WV | 5 |
| Wisconsin | D | R | R | R | D | R | R | D | R | R | D | D | D | D | D | D | D | | WI | 10 |
| Wyoming | D | R | R | R | D | R | R | R | R | R | R | R | R | R | R | R | R | | WY | 3 |
| State | 1948 | 1952 | 1956 | 1960 | 1964 | 1968 | 1972 | 1976 | 1980 | 1984 | 1988 | 1992 | 1996 | 2000 | 2004 | 2008 | 2012 | State |
AI - American Independent a far right party created by Bill and Eileen Shearer, (Eileen was the daughter of California senator Wiliam Knowland). George Wallace, former Alabama governor, ran as an AI in 1968.
I - Independent
SR = States' Rights - A far right, white supremacist party.
ECV = Electoral College Votes
* Prior to 1960 there were only 531 electoral votes and you needed 266 to win.
1. In 1968 George Wallace got 13.5% of the vote as an American Independent.
In 1992 Ross Perot got almost 19% of the vote as an independent.
In 1996 Perot got 8.4%.
In 2000 Ralph Nader got 2.7%, Gore, the looser in ECV, got 48.4%, Bush got 47.9% of the popular vote.
In 2016 Libertarian candidate Gary Johnson got 3% of the vote. Hillary Clinton, who lost, got 48.7% of the popular vote.
2. In 1992 and '96 Arkansas and Tennessee went republican for favorite sons Clinton and Gore
Sources:
List of United States presidential election results by state - Wikipedia
Popular Votes 1940-2012 - Roper Center
See Margin of victory - Republican & Democratic States in 2000 the closest election.
I had a housemate in grad school who was doing his PhD thesis on the fairness of the electoral system. He came to the conclusion that it was the best system. I don't remember the criteria he used to judge the the different options.
The 11 states with the largest population account for more than half of EC Votes.
|  Politics