Politics
2012 Election
2012 Republican Candidates
Politics
2012 Election
2012 Republican Candidates
| Don's Home
Politics
2012 Election
2012 Republican Candidates
|
|
This page is a high level overview of the campaign. It doesn't list who made what fopaw in what debate. See links below for more information.
Polling | Results | Primary Schedule |
How it Works | Iowa |
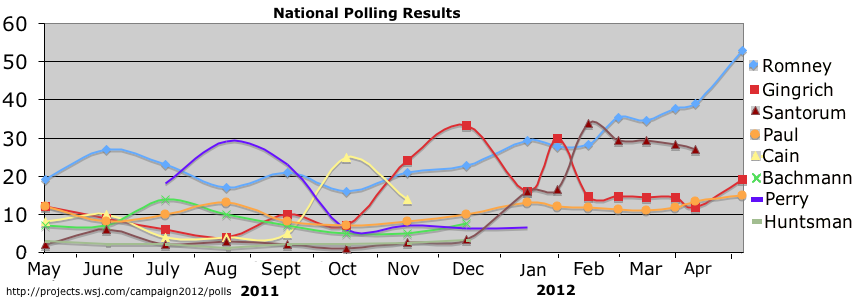
National Polling results:
Results vary considerably between different polls. For example in July polls Romney got from 16 to 30% and Bachmann got from 11 to 16%. See an example for Iowa below. Initial Primary Results
Primary Schedule and Results (Click on candidate name for a google search)
Source: Results of the 2012 Republican Party presidential primaries and Primaries 2012 at Wikipedia Preliminary 2012 Presidential Primary and Caucus Schedule at White House 2012 and Republican Delegate Allocation at TheGreenPapers.com proptnl - Delegates are allocated proportionally WTA - Winner-Take-All AP/CW - At-large delegates are proportional, Congressional District delegates are Winner-Take-All AP/CU - At-large delegates are proportional, Congressional District delegates are unbound AU/CW - At-large delegates are unbound, Congressional District delegates are Winner-Take-All Conv - The delegation will be elected on the floor of the state convention based on stated presidential preference. Open - Anyone feom any Party or unaffiliated registartion can vote in either the primary or caucus. Modified - Only registered Republicans and Registered Independent or unafilated voters can vote in the primary or caucus. Closed - Only registered Republicans can vote in the primary or caucus * If any candidate receives more than 50% of the votes it becomes a WTA contest. # If any candidate receives more than 66% of the votes it becomes a Winner-take-all contest. 1 The state, district or territory convention can vote to bind some or all of the delegates 3 This is simply a high-profile strawpoll. The real contest happens later.N/A - Caucus process can produce both pledged and unpledged convention delegates, depending on the party rules of the various states. Some states follow with a state convention In Pennsylvania each Republican delegate is allowed to support the candidate of their choice, irrespective of voting results in the GOP primary. see Republican Party presidential primaries, 2012 - Wikipedia
† Penalties:
       Delegates
 State      Normal Penalty
Arizona        58    29
Florida        99    50
Michigan       59    30
New Hampshire  23    12
South Carolina 50    25
‡ Missouri will hold a primary on Feb. 7th which will not count toward delegates, a caucus on March 17th will count.Nebraska will do something similar on May 15 and July 14. How it Works - (Delegates, Superdelegates, Open/Closed, Primary, Caucus) Some of the rules are determined by the national committee for each party and some by state organizations.
How is the number of delegates per state determined?
Terms:
Delegates are often party activists, local political leaders, or early supporters of a given candidate. A member of a county board or a local state representative or a state senator are frequently delegates. See: The Role of Delegates in the U.S. Presidential Nominating Process - Council on Foreign Relations
Superdelegates
are party leaders and elected officials ("PLEOs"). All the superdelegates are free to support any candidate for the nomination. In some states, delegates are bound, or "pledged" to vote for the primary winner in voting at the national convention. In other states some or all delegates are "unpledged," and free to vote for any candidate they wish at the convention.
See: Polls in a given state can vary quite a bit in the weeks and days leading up to the primary. Here is an example for Iowa. Iowa Caucus' (Polls of people likely to vote)
† Romney was originally declared the winner 30,015 (24.55%) to 30,007 (24.54%), but two weeks later on Jan. 18, the Iowa GOP said certified results showed Santorum was ahead by 34 votes, but no official winner was declared because votes from eight precincts were missing. See Fox News Daily Kos: Daily Kos Elections Iowa Republican caucuses liveblog thread #8 Classification - Moderate - Conservative Who's the Most Conservative GOP Contender? A Candidate Matrix - News - GOOD - August 13, 2011  "The candidates' matrix positions were determined by an algorithm of a one through five rating, five being the most conservative. The categories for fiscal issues were taxes, budget, corporation-friendliness, health care, and government programs. For social issues, they were abortion and sex, civil rights, war, environment, and immigration." Ranked [By DonsNotes] from most moderate to most extreme. 1-Jon Huntsman, 2-Mitt Romney, 3-Ron Paul, 4-Herman Cain, 5-Michele Bachmann, 6-Rick Perry
| |||||||||||||||||||||||||||||||||||||||||||||||||||||||||||||||||||||||||||||||||||||||||||||||||||||||||||||||||||||||||||||||||||||||||||||||||||||||||||||||||||||||||||||||||||||||||||||||||||||||||||||||||||||||||||||||||||||||||||||||||||||||||||||||||||||||||||||||||||||||||||||||||||||||||||||||||||||||||||||||||||||||||||||||||||||||||||||||||||||||||||||||||||||||||||||||||||||||||||||||||||||||||||||||||||||||||||||||||||||||||||||||||||||||||||||||||||||||||||||||||||||||||||||||||||||||||||||||||||||||||||||||||||||||||||||||||||||||||||||||||||||||||||||||||||||||||||||||||||||||||||||||||||||||||||||||||||||||||||||||||||||||||||||||||||||||||||||||||||||||||||||||||||||||||||||||||||||||||||||||||||||||||||||||||||||||||||||||||||||||||||||||||||||||||||||||||||||||||||||
|
"A Graphical Overview of the 2012 Republican Field", at the NY Times 538 blog, Feb. 2011 | |||||||||||||||||||||||||||||||||||||||||||||||||||||||||||||||||||||||||||||||||||||||||||||||||||||||||||||||||||||||||||||||||||||||||||||||||||||||||||||||||||||||||||||||||||||||||||||||||||||||||||||||||||||||||||||||||||||||||||||||||||||||||||||||||||||||||||||||||||||||||||||||||||||||||||||||||||||||||||||||||||||||||||||||||||||||||||||||||||||||||||||||||||||||||||||||||||||||||||||||||||||||||||||||||||||||||||||||||||||||||||||||||||||||||||||||||||||||||||||||||||||||||||||||||||||||||||||||||||||||||||||||||||||||||||||||||||||||||||||||||||||||||||||||||||||||||||||||||||||||||||||||||||||||||||||||||||||||||||||||||||||||||||||||||||||||||||||||||||||||||||||||||||||||||||||||||||||||||||||||||||||||||||||||||||||||||||||||||||||||||||||||||||||||||||||||||||||||||||||
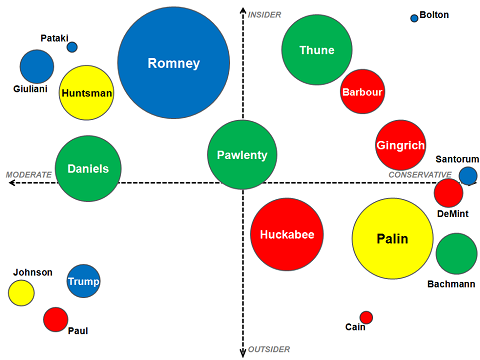 |
Nate Silver, who developed the chart, says, "One dimension is obvious: we can classify the candidates from left to right, from relatively more moderate to relatively more conservative. But another dimension that is often salient in the primaries, and perhaps especially so for Republicans next year, is what we might think of as the insider/outsider axis: whether the candidate is viewed as part of the Republican establishment, or as a critic of it."
Speculated candidates, Palin, Huckabee, Daniels, Thune, Giuliani, Trump and Christie never entered the campaign.
| ||||||||||||||||||||||||||||||||||||||||||||||||||||||||||||||||||||||||||||||||||||||||||||||||||||||||||||||||||||||||||||||||||||||||||||||||||||||||||||||||||||||||||||||||||||||||||||||||||||||||||||||||||||||||||||||||||||||||||||||||||||||||||||||||||||||||||||||||||||||||||||||||||||||||||||||||||||||||||||||||||||||||||||||||||||||||||||||||||||||||||||||||||||||||||||||||||||||||||||||||||||||||||||||||||||||||||||||||||||||||||||||||||||||||||||||||||||||||||||||||||||||||||||||||||||||||||||||||||||||||||||||||||||||||||||||||||||||||||||||||||||||||||||||||||||||||||||||||||||||||||||||||||||||||||||||||||||||||||||||||||||||||||||||||||||||||||||||||||||||||||||||||||||||||||||||||||||||||||||||||||||||||||||||||||||||||||||||||||||||||||||||||||||||||||||||||||||||||||||
|
The area of each candidate's circle is proportional to their perceived likelihood of winning the nomination, according to the Intrade betting market. The color of each circle reflects the region the candidate is from: blue for the Northeast, red for the South, green for the Midwest, and yellow for the West. Silver comments, "Gingrich is a difficult case, a former Speaker of the House (it's hard to get more establishment than that), led the 1994 Republican Revolution, but has more recently aligned himself with Tea Party groups." As of Dec. 5, intrade says there is a 30% change that Palin, Trump, Bloomberg, Paul OR Bachmann will run for President as Independent or 3rd party candidate. Rating the GOP candidates following the debate of - National Conservative | Examiner.com by Anthony Martin, 9/22/2011 Ratings for each candidate on the issues that are important to conservatives: the economy and jobs, gun rights, low taxes, runaway government spending and small government, abortion, foreign policy, the war on terror, national defense, stopping the onslaught of illegal aliens, and border security. The highest score is a 10, the lowest a 1. Michele Bachmann-9, Herman Cain-8, Newt Gingrich-8, Rick Santorum-8, Ron Paul-7, Rick Perry-7, Gary Johnson-6, Mitt Romney-3, Jon Huntsman-1, Rank Order the GOP Candidates Based on Likelihood to Plunge Us into Another War | Conservative Heritage Times - Oct. 6, 2011 1. Rick Santorum, 2. Newt Gingrich, 3. Michelle Bachmann, 4. Rick Perry, 5. Herman Cain, 6. Mitt Romney, 7. John Huntsman, 8. Gary Johnson, 9. Ron Paul 1 and 2 were easy and 7, 8 and 9 were easy. 3 through 6 were harder. The Patriot's 2012 GOP Candidate Ratings | Frank Talk, October 28, 2011 We have assigned all candidates a Patriot Rating based on comprehensive analysis of many factors. Among these are their record, experience, capability, character, leadership qualifications and, of course, a demonstrated ability to abide by their prescribed oath "to support and defend" our Constitution. We evaluate their record of defending Essential Liberty, and their support for restoration of constitutional limits upon government -- including the judiciary -- the promotion of free enterprise, national defense and traditional American values. The rating is from 1 to 10, the higher the better. We do not rate candidates on "electability." Newt Gingrich-6, Mitt Romney-6, Rick Perry-6, Herman Cain-5, Rick Santorum-4, Ron Paul-3, Michele Bachmann-3 Debates: There were 18 debates thru the Florida debate on January 23. See Presidential debate fatigue: How many is too many? - The Washington Post
January 26  - Jacksonville, FL
February 22 - Mesa, Arizona
March 1     - Georgia
March 5     - Simi Valley, CA
March 19    - Portland, OR
Videos YouTube Fact check: GOP debate's history flubs - CBS News
Links: Return to Politics
| |||||||||||||||||||||||||||||||||||||||||||||||||||||||||||||||||||||||||||||||||||||||||||||||||||||||||||||||||||||||||||||||||||||||||||||||||||||||||||||||||||||||||||||||||||||||||||||||||||||||||||||||||||||||||||||||||||||||||||||||||||||||||||||||||||||||||||||||||||||||||||||||||||||||||||||||||||||||||||||||||||||||||||||||||||||||||||||||||||||||||||||||||||||||||||||||||||||||||||||||||||||||||||||||||||||||||||||||||||||||||||||||||||||||||||||||||||||||||||||||||||||||||||||||||||||||||||||||||||||||||||||||||||||||||||||||||||||||||||||||||||||||||||||||||||||||||||||||||||||||||||||||||||||||||||||||||||||||||||||||||||||||||||||||||||||||||||||||||||||||||||||||||||||||||||||||||||||||||||||||||||||||||||||||||||||||||||||||||||||||||||||||||||||||||||||||||||||||||||||