History
Disasters, War, ...
Hurricanes
History
Disasters, War, ...
Hurricanes
| Don's Home
History
Disasters, War, ...
Hurricanes
| Contact |
|
Contents: Hurricane List | General Information | Season | Tracks | Storm Names | Category Scale
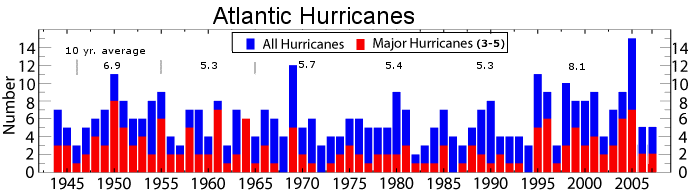 5 yr. periods: 1998-2002: 39; 2003-07: 40
Source: Atlantic Ocean Tropical Cyclones at the National Oceanic & Atmospheric Administration's (NOAA) National Climatic Data Center (NCDC)
| ||||||||||||||||||||||||||||||||||||||||||||||||||||||||||||||||||||||||||||||||||||||||||||||||||||||||||||||||||||||||||||||||||||||||||||||||||||||||||||||||||||||||||||||||||||||||||||||||||||||||||||||||||||||||||||||||||||||||||||||||||||||||||||||||||||||||||||||||||||||||||||||||||||||||||||||||||||||||||||||||||||||||||||||||||||||||||||||||||||||||||||||||||||||||||||||||||||||||||||||||||||||||||||||||||||||||||||||||||||||||||||||||||||||||||||||||||||||||||||||||||||||||||
1950-2000
| The 2005 Atlantic hurricane season was the most active Atlantic hurricane season in recorded history. Two of the most deadly storms were Katrina with a 30-foot storm surge that caused devastating flooding that inundated New Orleans and destroyed most structures on the Mississippi coastline, and Hurricane Stan in Guatemala, where it combined with an extratropical system to cause deadly mudslides. | |||||||||||||||||||||||||||||||||||||||||||||||||||||||||||||||||||||||||||||||||||||||||||||||||||||||||||||||||||||||||||||||||||||||||||||||||||||||||||||||||||||||||||||||||||||||||||||||||||||||||||||||||||||||||||||||||||||||||||||||||||||||||||||||||||||||||||||||||||||||||||||||||||||||||||||||||||||||||||||||||||||||||||||||||||||||||||||||||||||||||||||||||||||||||||||||||||||||||||||||||||||||||||||||||||||||||||||||||||||||||||||||||||||||||||||||||||||||||||||||||||||||||
| Four of the hurricanes were in the top 10 ever recorded in Accumulated Cyclone Energy (ACE) Ranking, Wilma, Emily, Rita, Katrina. Wilma set the record for low air pressure (measured in millibars [mb] or inches of mercury) in the eye, with a reading of (882 mb/26.05 in), another measure of storm strength. Record damages were over $128 billion USD. See Summary at Wikipedia.
Hurricane Season:
| ||||||||||||||||||||||||||||||||||||||||||||||||||||||||||||||||||||||||||||||||||||||||||||||||||||||||||||||||||||||||||||||||||||||||||||||||||||||||||||||||||||||||||||||||||||||||||||||||||||||||||||||||||||||||||||||||||||||||||||||||||||||||||||||||||||||||||||||||||||||||||||||||||||||||||||||||||||||||||||||||||||||||||||||||||||||||||||||||||||||||||||||||||||||||||||||||||||||||||||||||||||||||||||||||||||||||||||||||||||||||||||||||||||||||||||||||||||||||||||||||||||||||||
|
Category by Month (number of storms) (category over land for US storms 1995-2005)
| |||||||||||||||||||||||||||||||||||||||||||||||||||||||||||||||||||||||||||||||||||||||||||||||||||||||||||||||||||||||||||||||||||||||||||||||||||||||||||||||||||||||||||||||||||||||||||||||||||||||||||||||||||||||||||||||||||||||||||||||||||||||||||||||||||||||||||||||||||||||||||||||||||||||||||||||||||||||||||||||||||||||||||||||||||||||||||||||||||||||||||||||||||||||||||||||||||||||||||||||||||||||||||||||||||||||||||||||||||||||||||||||||||||||||||||||||||||||||||||||||||||||||
| | ||||||||||||||||||||||||||||||||||||||||||||||||||||||||||||||||||||||||||||||||||||||||||||||||||||||||||||||||||||||||||||||||||||||||||||||||||||||||||||||||||||||||||||||||||||||||||||||||||||||||||||||||||||||||||||||||||||||||||||||||||||||||||||||||||||||||||||||||||||||||||||||||||||||||||||||||||||||||||||||||||||||||||||||||||||||||||||||||||||||||||||||||||||||||||||||||||||||||||||||||||||||||||||||||||||||||||||||||||||||||||||||||||||||||||||||||||||||||||||||||||||||||||
Hurricanes which Affected the Continental United States (Thru Oct. 2007)
|
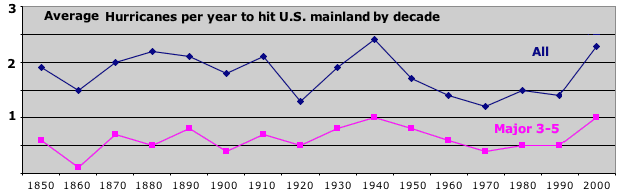
Major hurricane direct hits on the U.S. Mainland 1900-2000 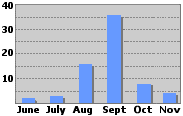 Source: National Oceanic & Atmospheric Administration (NOAA) | |||||||||||||||||||||||||||||||||||||||||||||||||||||||||||||||||||||||||||||||||||||||||||||||||||||||||||||||||||||||||||||||||||||||||||||||||||||||||||||||||||||||||||||||||||||||||||||||||||||||||||||||||||||||||||||||||||||||||||||||||||||||||||||||||||||||||||||||||||||||||||||||||||||||||||||||||||||||||||||||||||||||||||||||||||||||||||||||||||||||||||||||||||||||||||||||||||||||||||||||||||||||||||||||||||||||||||||||||||||||||||||||||||||||||||||||||||||||||||||||||||||||||
|
2006 had fewer hurricanes than predicted because of an El Nino which moderated them.
| ||||||||||||||||||||||||||||||||||||||||||||||||||||||||||||||||||||||||||||||||||||||||||||||||||||||||||||||||||||||||||||||||||||||||||||||||||||||||||||||||||||||||||||||||||||||||||||||||||||||||||||||||||||||||||||||||||||||||||||||||||||||||||||||||||||||||||||||||||||||||||||||||||||||||||||||||||||||||||||||||||||||||||||||||||||||||||||||||||||||||||||||||||||||||||||||||||||||||||||||||||||||||||||||||||||||||||||||||||||||||||||||||||||||||||||||||||||||||||||||||||||||||||
|
(Not adjusted for inflation)
|
| |||||||||||||||||||||||||||||||||||||||||||||||||||||||||||||||||||||||||||||||||||||||||||||||||||||||||||||||||||||||||||||||||||||||||||||||||||||||||||||||||||||||||||||||||||||||||||||||||||||||||||||||||||||||||||||||||||||||||||||||||||||||||||||||||||||||||||||||||||||||||||||||||||||||||||||||||||||||||||||||||||||||||||||||||||||||||||||||||||||||||||||||||||||||||||||||||||||||||||||||||||||||||||||||||||||||||||||||||||||||||||||||||||||||||||||||||||||||||||||||||||||||||
|
Hurricane List - Those with high death tolls or damage ($$)
Intensity Scale:
          Type        Wind Speed
Small craft advisory: 25-38 MPH
        Gale warning: 39-54
       Storm warning: 55-72
Tropical Storms
 Tropical Depression: < 39 MPH
      Tropical Storm: 39-73 MPH (storm surge < 4 ft.)
           Hurricane: > 73 MPH (See categories below)
The Beaufort Scale is another system rating storms by wind height and sea conditions and assigning Beaufort numbers from 1 to 12.
Saffir-Simpson Hurricane Scale
Only two Category 5 storms - the 1935 Key West Labor Day Storm, and Camile in 1969 which devastated Louisiana and Mississippi - have made landfall in the United States. Storm strength is also measured by the low air pressure (measured in millibars [mb] or inches of mercury) in the eye. A lower number indicates a stronger storm. The strongest storms on record are:
Another measurement is Accumulated Cyclone Energy (ACE) Ranking. ACE Storm 74 San Ciriaco 1899 70 Ivan 2004 68 Four 1926 65 Donna 1960 47 Frances 2004 39 Wilma 2005 38 Ike 2008 32 Emily 2005 25 Rita 2005 20 Katrina 2005 | ||||||||||||||||||||||||||||||||||||||||||||||||||||||||||||||||||||||||||||||||||||||||||||||||||||||||||||||||||||||||||||||||||||||||||||||||||||||||||||||||||||||||||||||||||||||||||||||||||||||||||||||||||||||||||||||||||||||||||||||||||||||||||||||||||||||||||||||||||||||||||||||||||||||||||||||||||||||||||||||||||||||||||||||||||||||||||||||||||||||||||||||||||||||||||||||||||||||||||||||||||||||||||||||||||||||||||||||||||||||||||||||||||||||||||||||||||||||||||||||||||||||||||
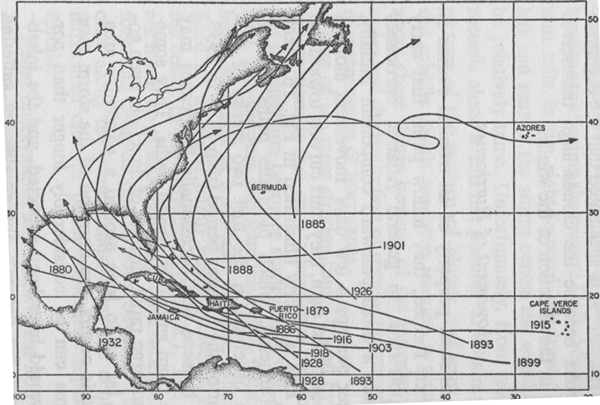
Mid-Atlantic and NE Hurricanes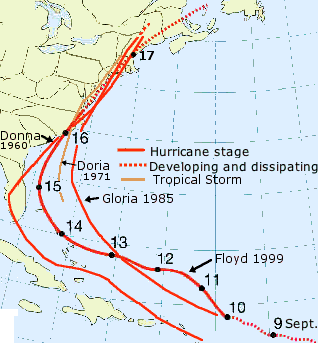 Source: www.geography.hunter.cuny.edu/~tbw /wc.notes/11.hurricanes/paths_hurricane_floyd.htm Other NJ Hurricanes: Gloria 1985, Bertha 1996, Doria 1971
|
 Floyd - 1999 |
| Tracks by year at NHC/TPC Archive of Hurricane Seasons from NOAA. State Hurricane History Paths: 2005 Counties: Florida,
See: Anatomy of a Hurricane 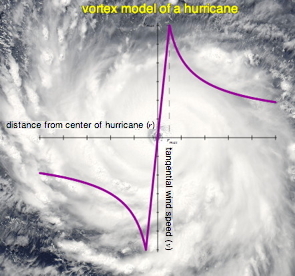
Rotational Energy - Practice - The Physics Hypertextbook Hurricane Basics at noaa.gov Storm Names: Tropical depressions are assigned names when they become tropical storms (circular storms with gale force [≥39 MPH] winds). The names come from six lists of given names in use since 1979. The names repeat (except for retired names) every 6 years. The names are in alphabetical order. All letters of the alphabet are used except Q, U, X, Y and Z. 21 names, based on the record in 1933, was sufficient until 2005 when there were 27 named storms. The average from 1950-2000 was 10 named storms per year. Dennis, Katrina, Rita, Stan and Wilma represent the type of devastating storm that is "retired" for causing a large loss of life and property. For 2011, Dennis, Katrina, Rita, Stan and Wilma have been replaced with Don, Katia, Rina, Sean and Whitney, respectively. See: Worldwide Tropical Cyclone Names at nhc.noaa.gov (National Hurricane Center (NHC) of the National Oceanic & Atmospheric Administration (NOAA).
Hurricane Cycles:
According to Kevin Trenberth at the National Center for Atmospheric Research in Boulder, Colo., the importance of natural influences in driving hurricane cycles is "way overblown by some hurricane guys,".
Rather, changes in hurricane incidence "in recent times are much more likely to be related to global warming," he said.
Hurricane Costs and Death Toll 1900-2000 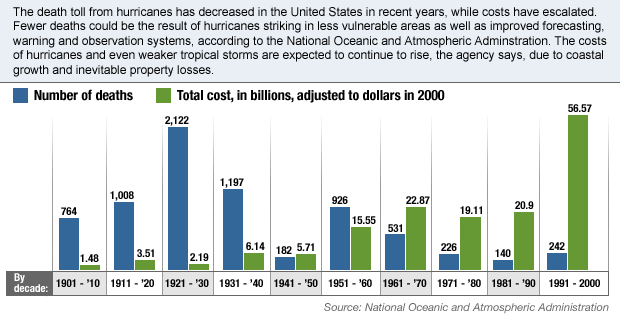 Source: CNN See: Hurricanes at Federal Emergency Management Agency (FEMA) - (Publications) nhc.noaa.gov (National Hurricane Center (NHC) of the National Oceanic & Atmospheric Administration (NOAA) Paleotempestology Resource Center Links & Resources at the National Climatic Data Center (NCDC) at NOAA Hurricane History at USA Today Hurricane History at NOAA (National Oceanic and Atmospheric Administration) Hurricane FAQ What years were the greatest and fewest seen? at NOAA Atlantic Hurricane Outlook at NOAA Hurricane Statistics at Environment Canada. Catastrophes Costs (Insured losses are about half of total losses listed above) US hurricane fatalities at University of Nebraska-Lincoln. Historically, 90 percent of all hurricane casualties have occurred from drowning and 10 percent from other causes. According to Belize's National Emergency Management Organization. 2005 Hurricane season at wikipedia.org Hurricane Central at weather.com 2005 Hurricane/Tropical Data for Atlantic
| |