|
Severity - Magnitude and Intensity:
The severity of an earthquake can be expressed in terms of both intensity and magnitude. However, the two terms are quite different, and they are often confused.
Intensity is based on the observed effects of ground shaking on people, buildings, and natural features. It varies from place to place within the disturbed region depending on the location of the observer with respect to the earthquake epicenter. The Modified Mercalli (MM) Intensity Scale is used for intensity in the U.S. It was developed in 1931 by the American seismologists Harry Wood and Frank Neumann. This scale, composed of 12 increasing levels of intensity that range from imperceptible shaking to catastrophic destruction.
The intensity is affected by how close the movement is to the surface, the rock or soil type, and the water content.
The Richter magnitude scale was developed in 1935 by Charles F. Richter of the California Institute of Technology.
Because of the logarithmic basis of the scale, each whole number increase in magnitude represents a tenfold increase in measured amplitude (ground motion); as an estimate of energy, each whole number step in the magnitude scale corresponds to the release of about 31 times more energy (and destructive power) than the amount associated with the preceding whole number value.
Scientists now favor a different magnitude scale for very large quakes
that shows the 1964 Alaska quake as 9.2; It was originally an 8.6.
The new rating is sometimes indicated with the Mw notation. The Mw stands for moment magnitude, and it represents a number integrating more of the waves energy released by an earthquake can produce. For example, the greater size now assigned to the 1964 quake takes into account very long-period waves Rowe calls "whole-earth oscillations," waves that took days to stop reverberating through the planet.
See: Severity and Glossary at usgs.gov
Glossary here
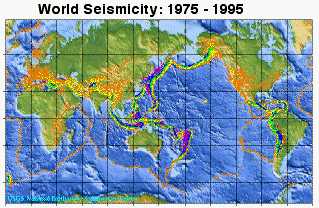
Source: neic.usgs.gov/neis/general/seismicity/world.html
Earthquakes with high casualties and those with magnitude > 7.5 since 1900
worldwide and recent quakes in the US
Bold entries are US Quakes
| Date Where | Deaths | Magni-
tude |
|
Largest Quakes since 1900
|
| 1960 S. Chile | 5 K | 9.5 * |
| 1964 Prince William Sound - Ancorage, Alaska (tsunami) | 131 | 9.2 * |
| 2004 Indian Ocean. Tsunamis near Indonesia affecting Sri Lanka, India, Indonesia, and other SE Asian and NE African countries. | 283 K+
| 9.1 |
| 1952 Kamchatka, Russia | | 9.0 |
| 1700 N. California, Oregon, Washington, and S. BC | | 9~ |
| 1906 Off the Coast, Ecuador | | 8.8 |
| 1965 Rat Isl., Alaska | | 8.7 |
| 1950 Assam, India/ Tibet | 20-30 K | 8.6 |
| 1920 Gansu, China | 180 K | 8.6 |
| 1933 Honshu, Japan (tsunami) | 3 K | 8.4 |
| See Also: Largest by Location below. |
|
Highest Death toll
|
1201 Near East & Egypt, Syria,
Eastern Mediterranean | 1 M | NA |
| 1556 Shansi, China | 830 K | NA |
| 1662 Anhwei, China | 300 K | NA |
| 1850 Sichuan, China | 300 K | |
1737 Calcutta, India
later research showed it was a typhoon not an earthquake. | 300 K | NA |
| 1976 Tangshan, China | 240-800 K | 7.5 |
| 2004 Indian Ocean. Tsunamis in Sri Lanka, India, Indonesia, and other SE Asian and NE African countries. | 228-
283 K | 9.1 |
| 1138 Aleppo, Syria | 230 K | NA |
| 1703 Jeddo, Japan | 200 K | NA |
| 856 Damghan, Iran | 200 K | NA |
1920 Haiyuan, Ningxia, (Gansu), China (Landslide) | 180 K | 7.8 |
| 1693 Catania, Sicily | 153 K | NA |
| 1923 Kuato (Great Tokyo Fire), Japan | 142 K | 7.9 |
| 1730 Hokkaido, Japan | 137 K | NA |
|
Quakes by year
|
1201 Near East & Egypt, Syria,
Eastern Mediterranean | 1 M | NA |
| 1556 Shansi, China | 830 K | NA |
| 1600: |
| 1662 Anhwei, China | 300 K | NA |
| 1693 Catania, Sicily | 153 K | NA |
| 1700: |
| 1700 Pacific NW - Tsunami reaches Japan | | NA |
| 1703 Jeddo, Japan | 200 K | NA |
| 1730 Hokkaido, Japan | 137 K | NA |
| 1730 Qili, China | 100 K | NA |
| 1737 Calcutta, India | 300 K | NA |
| 1755 Lisbon, Portugal (tsumani) | 60-90 K | ext. 8.7 |
| 1783 NJ | NA | 5.3 |
| 1787 Puerto Rico | NA | 8.0 |
| 1800: |
| 1811 New Madrid, Mo | NA | 7.7-8.2 |
| 1812 New Madrid, Mo | NA | 7.9 + |
| 1838 San Francisco area, Calif. | NA | 6.8 |
| 1850 Sichuan, China | 300 K | |
| 1857 Ft. Tejon (near Parkfield), N Calif. | 1 | 7.9 |
| 1868 Ka'u District, Island of Hawaii | 77 | 7.9 |
| 1868 Hayward Fault, N Calif. | 30 | 6.8 |
| 1871 Wilmington, DE & NJ | | |
| 1872 Owens Valley, Calif. | 27 | 7.4 |
| 1883 Java | 100 K |
| 1886 Charleston, SC | | 7.0 |
| 1892 Imperial Valley, Calif. | | 7.8 |
| 1899 Yakutat Bay, Alaska | | 8.2 |
| 1899 Near Cape Yakataga, Alaska | | 8.2 |
| 1900: |
| 1900 Kodiak Island, Alaska | | 7.9 |
| 1905 Mongolia, | | 8.4 |
| 1906 San Francisco, N. Calif. | 450-3 K | 7.7-8.3 |
| 1906 Off the Coast, Ecuador | | 8.8 |
| 1906 Valparaiso, Chile | 20 K | 9.5 * |
| 1908 Messina, Italy | 83 K | 7.5 |
| 1911 Morgan Hill, N. Calif. | | 6.6 |
| 1915 Avezzano, Italy | 30 K | 7.5 |
| 1915 Pleasant Valley, Nev. | | 7.7 |
| 1917 Yunnan, China | 1,800 | 7.5 |
| 1920 Haiyuan, Ningxia, (Gansu) China (Landslide) | 180 K | 7.8 |
| 1922 Eureka, Calif. | | 7.3 |
| 1923 Kuato (Great Tokyo Fire), Japan | 142 K | 8.3 |
| 1923 Kamchatka, Russia | | 8.5 |
| 1923 Off Cape Mendocino, N. Calif. | | 7.2 |
| 1923 Near Luhuo, Sichuan, China | 3,500 | 7.3 |
| 1925 Yunnan, China | 5,800 | 7.1 |
| 1927 Tsinghai (Nan-Shan), China | 41 K | 7.6 |
| 1927 W. of Lompoc, S. Calif. | | 7.3 |
| 1931 Xinjiang, China | 10 K | 8.0 |
| 1932 Gansu, China | 70 K | 7.6 |
| 1932 Mexico | | 8.1 |
| 1933 Sichuan, China | 9,300 | 7.4 |
| 1933 Long Beach, S. Calif | 120 | 6.4 |
| 1933 Honshu, Japan (tsunami) | 3 K | 8.4 |
| 1934 Bihar-Nepal, India | 11 K | 8.1 |
| 1935 Quetta, India | 39 K | 7.5 |
| 1938 Banda Sea, Indonesia | | 8.5 |
| 1939 Chilan, Chile | 28 K | 8.3 |
| 1939 Erzincan, Turkey | 30 K | 7.9 |
| : |
| 1940 Imperial Valley, Calif. | 9 | 7.1 |
| 1946 Honshu, Japan | 2 K | 8.4 |
| 1946 Dominican Republic | 100 | 8.0 |
| 1948 Sichuan, China | 800 | 7.3 |
|
| 1950 Assam, India/Tibet | 20-30 K | 8.6 |
| 1950 Cusco, Peru | 1,526 | 6.0 |
| 1952 Kamchatka, Russia | | 9.0 |
| 1952 Kern Co., Calif. | 12 | 7.5 |
| 1954 Eureka, Calif. | 1 | 6.5 |
| 1954 Dixie Valley, Nev. | | 7.3 |
| 1955 El Reno, Oklahoma | | 5.5 |
| 1956 N. Afghanistan | 2 K | 7.7 |
| 1957 Andreanof Isl., Alaska | | 9.1 |
| 1957 Fort Tejon, S. Calif. | | 7.9 |
| 1958 Lituya Bay, Alaska | | 8.3 |
| 1959 Hebgen Lake, Montana | | 7.3 |
| : |
| 1960 S. Chile | 5 K | 9.5 * |
| 1963 Kuril Islands, Russia | | 8.5 |
1964 Prince William Sound - Ancorage,
Alaska (tsunami) | 131 | 9.2 * |
| 1965 Rat Isl., Alaska | | 8.7 |
| 1966 Hebei, China | 1,000 | 6.9 |
| 1966 Hebei, China | 1,000 | 7.0 |
| 1969 Guangdong, China | 3 K | 5.9 |
| 1970 N. Peru | 67 K | 7.7 |
| 1970 Yunnan Province, China | 10 K | 7.5 |
| 1971 San Fernando, S. Calif. | 65 | 6.7 |
| 1972 - Nicaragua | 5 K | 6.2 |
| 1974 - China | 20 K | 6.8 |
| 1975 - Haicheng, China | 2 K | 7.0 |
| 1976 Tangshan, China | 240-800 K | 8.2 |
| 1976 Guatemela | 23 K | 7.5 |
| 1976 Mindanao, Philippines | 8 K | 7.8 |
| 1976 E. Turkey | 4 K | 7.9 |
| 1976 Tangshan, China | 255 K | 7.5 |
| 1977, 1978, 1979 |
| 1977 Indonesia | 200 | 8.0 |
| 1977 N.W. Argentina | 100 | 8.2 |
| 1977 Bucharest, Romania | 2 K | 7.5 |
| 1978 Sendai, Japan | 21 | 7.5 |
| 1978 Tabas, N.E. Iran | 25 K | 7.7 |
| 1979 Indonesia | 100 | 8.1 |
| 1979 Columbia, Ecuador | 800 | 7.9 |
|
| 1980, 1981, 1982, 1983, 1984: |
| 1980 SANTA CRUZ ISLANDS | | 7.9 |
| 1980 W. of Eureka, N. Calif. | | 7.4 |
| 1980 Mammoth Lakes, S. Calif. | | 6.7 |
| 1983 Okushiri, Japan tsunami | 200 | 7.8 |
| 1983 Coalinga, N. Calif. | | 6.5 |
| 1983 Borah Peak, Idaho | | 7.3 |
| 1984 Morgan Hill, N. Calif. | | 6.2 |
| 1985, 1986, 1987, 1988, 1989
|
| 1985 Michoacan near Mexico City | 9,500 | 8.0 |
| 1985 Chile | 146 | 7.8 |
| 1986 Andreanof Isl., Alaska | | 8.0 |
| 1986 Gulf of Alaska, Alaska | | 7.9 |
| 1988 Armenia, USSR | 25 K | 6.9 |
| 1989 Loma Prieta, S.F. Bay Area, N. Calif. | 67 | 7.1 |
| |
| 1990: |
| N.W. Iran | 50 K | 7.7 |
| MARIANA ISLANDS | | 7.5 |
| LUZON, PHILIPPINE | 1,621 | 7.8 |
| SOUTH OF FIJI ISL | | 7.4 |
|
| 1991 |
| COSTA RICA | 47 | 7.6 |
| 1991 NW of Eureka, N. Calif. | | 7.1 |
| GUATEMALA | 25 | 6.1 |
|
| 1992 |
| Landers-Yucca Vly, S. Calif. | 1 | 7.6 |
| Petrolia, off coast of N. Calif. | | 7.2 |
| KYRGYZSTAN. | 75 | 7.4 |
| MINDANAO, PHILIPPINES | | 7.5 |
| NEAR COAST OF NICARAGUA | 116 | 7.2 |
| NORTHERN COLOMBIA | 10 | 7.3 |
| FLORES REGION, INDONESIA | 2,200 | 7.5 |
|
| 1993 |
| HOKKAIDO, JAPAN REGION. | 1 | 7.5 |
| SOUTH OF MARIANA ISLANDS. | | 7.5 |
| Latur, India | 10 K | 6.0 |
| 1994 |
Northridge, San Fernando Vly, S. Calif.
$25 B in damage. | 72 | 6.7 |
| Offshore, W of Cape Mendocino, N. Calif. | | 7.1 |
| S. OF JAWA, INDONESIA | 250 | 7.8 |
| Off E. Coast of Honshu, JAPAN | 2 | 7.7 |
| Bolivia | | 8.2 |
| 1995 (7.0 or greater listed from here) |
| Where | Deaths | Magni-
tude |
| Kobe, Japan | 5,400 | 7.2 |
| E. Coast of N. Isl. NZ | | 7.0 |
| TONGA ISLANDS. | | 7.4 |
| SAMAR, PHILIPPINES | | 7.1 |
| PHILIPPINE ISLANDS. | | 7.0 |
| Loyalty Isl. Rgn., New Caledonia | | 7.3 |
| SAKHALIN ISLAND. | | 7.1 |
| KERMADEC ISLANDS, NZ | | 7.2 |
| NEAR COAST OF N. CHILE. | 3 | 7.5 |
| SOLOMON ISLANDS. | | 7.4 |
| MARIANA ISLANDS. | | 7.0 |
| Offshore, W of Cape Mendocino, N. Calif. | | 6.8 |
| NEAR COAST OF GUERRERO, MEXICO | 3 | 7.5 |
| NEAR COAST OF JALISCO, MEXICO | 38 | 7.6 |
| CHIAPAS, MEXICO. | | 7.3 |
| EGYPT. | 8 | 7.0 |
| KURIL ISLANDS. | | 7.8 |
| BANDA SEA. | | 7.1 |
|
| 1996 |
| MINAHASSA PENINSULA, SULAWESI | 8 | 7.6 |
| KURIL ISLANDS | | 7.0 |
| IRIAN JAYA REGION, INDONESIA | 108 | 8.1 |
| SOLOMON ISLANDS | 1 | 7.5 |
| ANDREANOF ISLANDS, ALEUTIAN IS | | 7.6 |
| SAMAR, PHILIPPINE ISLANDS | | 7.0 |
| NEAR COAST OF PERU. | 14 | 7.3 |
| 1996 Total Deaths 419 |
|
| 1997 |
| PAKISTAN | 57 | 7.3 |
| SANTA CRUZ ISLANDS. | | 7.7 |
| NORTHERN IRAN | 1,567 | 7.3 |
| XIZANG | | 7.9 |
| NEAR EAST COAST OF KAMCHATKA | | 7.6 |
| 1997 Total Deaths 2,900 |
|
| 1998 |
| N. Afghanistan and Tajikistan | 2,323 | 5.9 |
| BALLENY ISLANDS REGION | | 8.0 |
| SOUTHEAST OF TAIWAN | | 7.3 |
| NEAR N COAST OF NEW GUINEA | 2,183 | 7.1 |
| NEAR COAST OF ECUADOR | 3 | 7.1 |
| CERAM SEA, Indonesia | 34 | 8.1 |
| 1998 Total Deaths 8,928 |
|
| 1999 |
| Izmit, Turkey | 17 K | 7.4 |
| Taichang, Taiwan | 2,295 | 7.5 |
| Hector Mine, S. Calif. | | 7.4 |
| Oaxaca, Mexico | 18 | 7.5 |
| Vanuatu Islands | | 7.5 |
| Mojave desert, S. Calif. | | 7.1 |
| Bolu-Duzce Turkey | 894 | 7.5 |
| SANTA CRUZ ISLANDS | | 7.3 |
| NEW BRITAIN REGION, P.N.G. | | 7.0 |
| VANUATU ISLANDS. | 5 | 7.2 |
| LUZON, PHILIPPINE ISLANDS. | 5 | 7.1 |
| Western Colombia | 1,171 | 6 |
| 2000: |
| Southern Sumatera, Indonesia, | | 8.0 |
| South Indian Ocean, | | 7.8 |
| Volcano Islands, Japan, | | 7.6 |
| Minahassa Peninsula, Sulawesi | | 7.6 |
| New Ireland Region, P.N.G. | 2 | 8.0 |
| New Ireland Region, P.N.G. | | 7.8 |
| VANUATU ISLANDS REGION | | 7.1 |
| SULAWESI, INDONESIA | 46 | 7.5 |
| SAKHALIN ISLAND, RUSSIA | | 7.1 |
| Yountville (Napa Valley), Calif. | | 5.2 |
|
| 2000 Total Deaths 225 |
|
| 2001 |
| El Salvador | 844 | 7.7 |
| Bhuj, Gujarat, India | 20 K | 7.7 |
| Mindanao, Philippines, | | 7.5 |
| Near Coast of Peru | 138 | 8.4 |
| Near Coast of Peru | | 7.6 |
| Qinghai-Xinjiang Border, China | | 7.8 |
| VANUATU ISLANDS | | 7.1 |
| KODIAK ISLAND REGION, Alaska | | 7.0 |
| SOUTHERN SUMATERA, INDONESIA | | 7.4 |
| NORTHERN MOLUCCA SEA | | 7.1 |
| TURKMENISTAN | 11 | 7.5 |
|
| 2001 Total Deaths 21,358 |
|
| 2002 |
|
| VANUATU ISLANDS | | 7.2 |
| Turkey | 318 | 6.5 |
| Mindanao, Philippines | 173 | 7.5 |
| Hindu Kush, Afghanistan | 100 | 7.4 |
| N. Afghanistan | 1,000 | 5.9 |
| MINDANAO, PHILIPPINES | 15 | 7.5 |
| Priamurye-Northeastern China border region | | 7.3 |
| MARIANA ISLANDS | | 7.1 |
| FIJI ISLANDS REGION | | 7.6 |
| NEAR NORTH COAST OF NEW GUINEA | | 7.6 |
| IRIAN JAYA REGION, INDONESIA | | 7.6 |
| Central Alaska | | 7.9 |
|
| 2003 |
| SOLOMON ISLANDS | | 7.3 |
| OFFSHORE COLIMA, MEXICO | 29 | 7.6 |
| ALEUTIAN ISLANDS, Alaska | | 7.0 |
| Turkey | 100 | 6.4 |
| Algeria | 2-3 K | 6.8 |
| Southern Xinjiang, China | 261 | 6.3 |
| Japan (Honshu) | | 7.0 |
| Indonesia | | 7.0 |
| AMAZONAS, BRAZIL | | 7.1 |
| SCOTIA SEA | | 7.5 |
| CARLSBERG RIDGE, Arabian Sea | | 7.6 |
| SOUTH ISLAND OF NEW ZEALAND | | 7.2 |
| Hokkaido, Japan | | 8.3 |
| San Simeon, Calif. | 2 | 6.5 |
| Bam, Iran | 41 K | 6.5 |
| 2004: |
| PAPUA, INDONESIA | 37 | 7.0 |
| North of Macquarie Island | | 8.1 |
| N. Iran | 35 | 6.3 |
| STRAIT OF GIBRALTAR/ Morocco | 628 | 6.4 |
| Queen Charlotte Isl. (NW British Columbia) | | 6.9 |
| Fiji Region | | 7.1 |
| S. SUMATRA, INDONESIA | | 7.3 |
| S. coast of Honshu Japan | | 7.2 |
| Parkfield, Calif. | | 6.0 |
| Indian Ocean. A tsunami from an earthquake near Indonesia which spread over more than 10 countries in SE Asia and NE Africa. Sri Lanka, India, and Indonesia were worst hit. | 228-
283 K | 9.0 |
| 2005: |
| Iran | 612 | 6.4 |
| Northern Sumatra, Indonesia | 1,000 | 8.7 |
| Off the coast of N. Calif. (Crescent City) | | 7.2 |
| Tarapaca, Chile | 11 | 7.8 |
| Pakistan, India - 3 Million homeless | 86 K+ | 7.6 |
| 2006: |
| Yogyakarta, Java, Indonesia | 5 K+ | 6.3 |
| Tonga | | 8.0 |
| Big Island of Hawaii | 0 | 6.6 |
| Kuril Islands (NE of Japan) | 0 | 8.3 |
| SW. Taiwan | 3 | 7.1 |
| 2007: |
| East Of The Kuril Islands | | 8.1 |
| Molucca Sea. | | 7.5 |
| Vanuatu Islands. | | 7.1 |
| Solomon Islands. | 52 | 8.1 |
| Vanuatu. | | 7.2 |
| Java, Indonesia. | | 7.5 |
| Near The Coast Of Central Peru. | 514 | 8.0 |
| Santa Cruz Islands. | | 7.2 |
| Southern Sumatra, Indonesia. | 25 | 8.4 |
| Kepulauan Mentawai Region, Indonesia. | | 7.9 |
| Kepulauan Mentawai Region, Indonesia. | | 7.0 |
| Volcano Islands, Japan Region. | | 7.4 |
| Auckland Islands, New Zealand Region. | | 7.4 |
| Pagan Region, Northern Mariana Islands. | | 7.2 |
| Antofagasta, Chile. | 2 | 7.7 |
| Molucca Sea. | 3 | 7.5 |
| Martinique Region, Windward Islands. | 1 | 7.4 |
| South Of The Fiji Islands. | | 7.8 |
| Andreanof Islands, Aleutian Is., Alaska. | | 7.1 |
| 2008: |
| SIMEULUE, INDONESIA | 3 | 7.5 |
| Wells, NV | | 6.0 |
| Salem, IL | | 5.2 |
| SW Sichuan province, China | 65 K- 88 K | 7.8 |
| recent earthquakes at the USGS |
Abbreviations:
P.N.G. - Papua New Guinea,
NZ - New Zeland
Source: Historic Worldwide Earthquakes at earthquake.usgs.gov
* Scientists now favor a different magnitude scale for very large quakes
that shows the 1964 Alaska quake as 9.2; It was originally an 8.6 and the 1960 Chile quake as 9.5, originally 8.3
Largest Earthquakes since 1900 (Magnitudes have been estimated for earthquakes as early as 1810, but reliable data has only been available from the early 1900's.
See: 15 Largest earthquakes since 1900 at earthquake.usgs.gov
| Chile | 9.5 | (1960) | 9.0 | 8.7 | 8.5 | 8.3 | 8.2 | 8.2 | 8.2 |
| Alaska | 9.2 | (1964) | 8.7 | 8.6 | 8.2 | 8.1 | 8.0 | |
| Indonesia | 9.1 | (2004) | 8.6 | 8.5 | 8.5 | 7.9 | |
| Russia * | 9.0 | (1952) | 8.5 | 8.5 | 8.3 | 8.3 | |
| Japan | 8.4 | (1933) | 8.3 | 8.1 | 8.1 | 8.0 | |
| China | 8.6 | (1950) | 8.5 | 8.0 | 8.0 | | |
| Peru | 8.4 | (2001) | 8.2 | 8.2 | 8.1 | 8.1 | 8.0 |
| Mongolia | 8.4 | (1905) | 8.1 | |
| Bolivia | 8.2 | (1994) | | |
| Mexico | 8.1 | (1932) | 8.0 |
| India | 8.1 | (1934) | |
| Dominican Republic | 8.0 | (1946) | |
| Papua New Guinea | 8.0 | (2000) | 8.0 |
* Kamchatka Peninsula and Kuril Islands North of Japan
Are Earthquakes Increasing?
There are several web pages which claim there is an increase in the number of earthquakes. Both secular and religious seers regard earthquakes to be a sign that civilization faces an impending cataclysm. E.g. In an article, "Signs of the End of the Age", at prophecyandcurrentevents.com/, they give stats from J. R. Church and Gary Stearman, editors of the magazine Prophecy in the News, which
claimed that the number of Richter magnitude 6.0 and greater earthquakes worldwide has been increasing from nine in the 1950s to over 100 in the 90's.
Stearman cites as his source the October 11, 1995 issue of the newspaper Philadelphia Inquirer.
The computer-searchable archives of the Philadelphia Inquirer reveal no article.
When Stearman's readers confronted him with much more earthquake data than in the Philadelphia Inquirer, he was compelled to revise significantly these numbers. However, Stearman still insists that earthquakes are increasing.
(See The Institute for Creation Research article "Earthquakes and Endtimes" at www.icr.org)
The graph at the top of the page shows a 30 year cycle for "major" (magnitude 7.0 to 7.9) and "great" (magnitude 8.0 and higher) earthquakes, but the long term trend is flat. The number of strong (magnitude 6.0-6.9) quakes recorded increased over the 20th centuury, but many events smaller than magnitude 6.5 were not reported or properly measured for the early part of the century.
Source: (USGS) -
Earthquake Facts and Statistics.
A linear regression best fit line has a slope of -3.6 ie. Magnitude 5-6 earthquakes are decreasing slightly over the last 35 years.
Source: (USGS) -
Earthquake Facts and Statistics.
The U.S. Geological Survey (USGS) issued a press release in 1999 stating:
A partial explanation for the impression of increased earthquakes may be that in the last twenty years, we have definitely had an increase in the number of earthquakes the USGS has been able to locate each year. This is because of the tremendous increase in the number of seismograph stations in the world and the many improvements in global communications."
...
Also, the effect that earthquakes have when they strike is generally more pronounced. Although we have gained much knowledge in building safer structures, when earthquakes occur today, losses (both human and property) are greater in many areas of the world. This is not because the earthquakes are stronger; it is simply because the Earth's population is increasing and more property (much of it not built to withstand earthquakes) exists that can be destroyed in an earthquake.
See: Earthquakes and the End Times - Confronting an Urban Legend at The Institute for Creation Research (www.icr.org/).
Earthquake Prediction:
In Earthquake Prediction, (2004) at U. Wash., Ruth Ludwin says:
"There is great interest in predicting the location and time of large earthquakes. Although a great deal is known about where earthquakes are likely, there is currently no reliable way to predict the days or months when an event will occur in any specific location."
Links:
Links to earthquake prediction sites at earthwaves.org.
A psychics have predicted large quakes in California in 2000, June 25, 2007 and other dates.
USA Earthquakes
See "Deaths from Earthquakes in the United States" at neic.usgs.gov/neis/eqlists/us_deaths.html
The first California statewide earthquake forecast, produced by the USGS, Southern California Earthquake Center and California Geological Survey, in April, 2008 set the probability of a 6.7 or larger quake in the next 30 years (by 2037) at 67% in Southern California and 63% in Northern California.
There is a 59% chance that a Northridge-size (6.7) quake will occur on the southern section of the San Andreas fault and a 21% chance for the northern section. The Hayward and San Jacinto faults have a 31% chance of a 6.7 or higher quake.
The likelihood of a major quake of magnitude 7.5 or greater in the next 30 years is 46%-and such a quake is most likely to occur in the southern half of the state.
See: California faults and earthquakes: Northern California, Southern California
Fact Sheet at pubs.usgs.gov/fs/2008/ and USGS CoreCast
On the basis of research conducted since the 1989 Loma Prieta earthquake in Northern California The U.S. Geological Survey (USGS) and other scientists conclude that there is a 62% probability of at least one magnitude 6.7 or greater quake, capable of causing widespread damage, striking the San Francisco Bay region before 2032. See: 2003 Earthquake Probability Study by the USGS
S. Calif. Earthquake Index
Map of Calif. quakes this week
Notable California Earthquakes
Bay Area map 1769-1997
Bay Area Earthquake Probability
25 Largest Earthquakes in the US
See: recent earthquakes | Significant Earthquakes by year.
Twentieth Century Earthquakes - Confronting an Urban Legend at The Institute for Creation Research icr.org
See Also:
last updated 23 May 2008
|
 History